Free Access
Fig. 3.
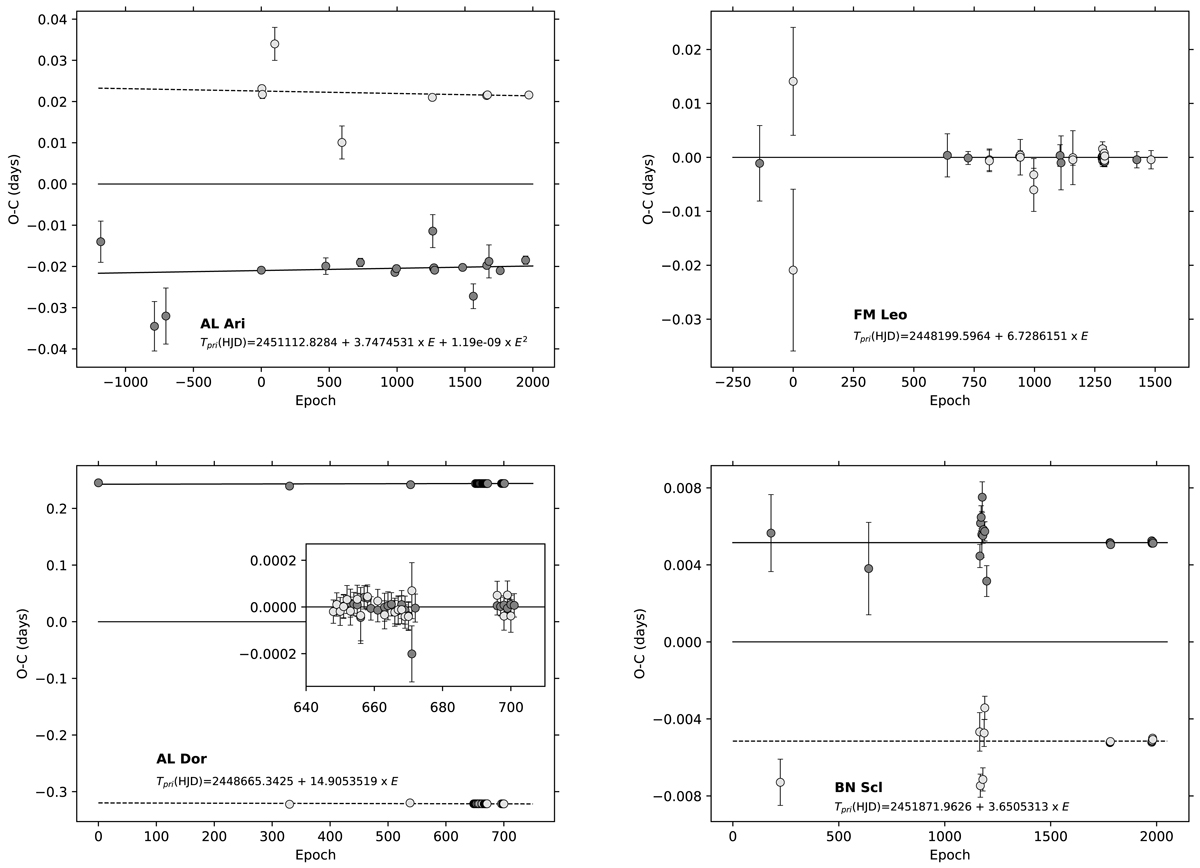
O − C diagrams of minima times. A linear term and, in case of AL Ari also a quadratic term, has been subtracted. Dark grey filled circles correspond to primary minima, and light grey ones to secondary minima. The inset in the panel for AL Dor shows the residuals of the model fit.
Current usage metrics show cumulative count of Article Views (full-text article views including HTML views, PDF and ePub downloads, according to the available data) and Abstracts Views on Vision4Press platform.
Data correspond to usage on the plateform after 2015. The current usage metrics is available 48-96 hours after online publication and is updated daily on week days.
Initial download of the metrics may take a while.