| Issue |
A&A
Volume 649, May 2021
|
|
|---|---|---|
| Article Number | A35 | |
| Number of page(s) | 14 | |
| Section | Planets and planetary systems | |
| DOI | https://doi.org/10.1051/0004-6361/202140435 | |
| Published online | 07 May 2021 | |
Sublimation of ice-dust mixtures in cooled vacuum environments to reproduce cometary morphologies★
1
Institut für Planetenforschung, Deutsches Zentrum für Luft- und Raumfahrt (DLR),
Berlin,
Germany
e-mail: This email address is being protected from spambots. You need JavaScript enabled to view it.
2
Institut für Geophysik und Extraterrestrische Physik, Technische Universität Braunschweig, Braunschweig,
Germany
3
Physikalisches Institut, Universität Bern,
Bern,
Switzerland
Received:
28
January
2021
Accepted:
22
March
2021
Abstract
Aims. The morphology of cometary surfaces can provide important information to constrain the composition and evolution of comets. In this work, we investigate the sublimation behavior of comet analog materials and how the sample composition affects the evolution of morphological features in laboratory experiments. In our experiments, we used dust ice mixtures as analog material to form observed cometary morphologies.
Methods. We used ice-dust mixtures in different mixing ratios as cometary analog material. In order to obtain realistic results, we scaled the expected cohesive and gravitational forces on comets to laboratory conditions. The samples were placed in a vacuum sublimation chamber and permanently cooled down to temperatures below 150 K to simulate the space environment. In the experiment, the samples were insolated with a light source from two different directions and alterations on the surface were recorded with a camera.
Results. We find that the morphology of sublimation residues of ice-dust mixtures is strongly dependent on the ice-dust ratio as well as the insolation direction. High amounts of ice cause constant surface alteration and lead to exotic morphologies. Low amounts cause fewer and more episodic surface changes during its sublimation. Collapse events resulting in irregular and very rough surfaces occur during horizontal insolation.
Key words: comets: general / methods: laboratory: solid state / planets and satellites: formation
Movies associated to Figs 6 and 8 are available at https://www.aanda.org
© ESO 2021
1 Introduction
In the past, several space missions have been sent to comets to study their properties at a close range (e.g., ESA’s Rosetta mission and NASA’s Deep Impact mission). Despite these visits, the activities on the surface of comets are still not well understood. Satellite-based observations have shown that the surfaces of comets become very active as they approach the Sun (Snodgrass et al. 2013; Gulkis et al. 2015; Sierks et al. 2015) by which we mean the occurrence of sublimation-driven outgassing events. The main process responsible for this activity is the sublimation of volatiles in a shallow subsurface region of a comet. It is caused by the direct radiation of solar energy onto surfaces in an air-less environment. Since comets also consist of nonvolatile minerals, salts, and organic substances, volatile-depleted residues remain after the sublimation of the ices. The pressure drag of sublimating volatiles detaches volatile and nonvolatile particles and gas drag transports them away from the surface (Kührt & Keller 1994; Gundlach et al. 2015; Keller et al. 2017; Bischoff et al. 2019). In this way, a comet loses material with each orbit around the Sun and diverse morphological features form at its surface. Based on Rosetta data, the tensile strength was estimated from overhangs (Groussin et al. 2015; Attree et al. 2018), fractures were proposed to be related to desiccation processes (El-Maarry et al. 2015), and boulder size frequency distributions were used as indicators of evolutionary processes (Pajola et al. 2015, 2016a,b). To enhance our understanding of these sublimation-driven processes, the morphologies of the cometary surfaces as well as the morphologies developing under laboratory conditions need to be further examined. Chemical composition, grain size, porosity, and gravitational and cohesive forces between individual particles decisively determine how the surface of a comet develops. Therefore, the comparison of morphological features in the laboratory with those at a comet’s surface may provide information about its composition and could constrain the evolutionary history of comets.
The KOSI laboratory experiments in the 1990s simulated and studied sublimation processes that were expected on the surfaces of comets (e.g., Grün et al. 1989, 1993; Lämmerzahl et al. 1995). In a sublimation chamber, mixtures of water ice and nonvolatile analog materials were illuminated by an energy source and the changes in the samples’ surfaces were analyzed. After prolonged insolation of the samples, an ice-free cover layer formed, which protected deeper layers from warming up and it prevented further activity.
Cometary science got a recent boost with the Rosetta mission. Since the spacecraft reached comet 67P/Churyumov-Gerasimenko (hereafter 67P), we obtained detailed images of its surface and improved our knowledge of organic materials on a comet (Capaccioni et al. 2015; Goesmann et al. 2015; Raponi et al. 2020). However, in order to properly interpret the morphologies displayed in Rosetta images, an understanding of the nucleus composition, in particular its dust-to-ice ratio, is vital. Therefore, analog studies with vacuum sublimation chambers have been increasingly dedicated to the development of specific morphologic features. The Simulation Chamber for Imaging the Temporal Evolution of Analogue Samples (SCITEAS; Pommerol et al. 2015) allowed monitoring and photometric analyses of volatile-rich samples during the process of sublimation. The chamber provided temperatures and low pressure comparable to conditions on comets for low heliocentric distances. With this chamber, Poch et al. (2016a,b) investigated the influence of organic materials and mineral components on the sublimation behavior of water ice. The presence of organic material results in significant textural differences on the sample’s surface after sublimation of the volatiles. Samples with refractory grains included in the ice matrix (intra-mixtures) produced very porous (foam-like) and highly cohesive structures. On the other hand, when the components were mixed with each other as pure particles (inter-mixtures), more compact and less cohesive residuals at the surface of the samples formed (Poch et al. 2016a,b). However, the concentrations of nonvolatile components in the initial sample mixtures were very low with up to one mass percent and, therefore, they are not representative of realistic cometary regoliths. Additionally, the arrangement of the samples in molds was not suitable to allow vertical mass transport. This is why the samples could not reproduce the observed morphologies of a cometary surface. Other experiments by Kaufmann & Hagermann (2018) were used to analyze the influence of carbon black on the sublimation of icy surfaces. They verified the hardening of a subsurface layer as described by Kochan et al. (1989) and Kossacki et al. (1997) and the development of an ice-depleted cover with a very low density. Most of these experiments were conducted using a very high and possibly unrealistic volatile content of >90 wt.%. Experiments focusing on the development and evolution of morphologies using a more realistic dust-to-ice ratio are conducted in this work.
Previous experimental work has shown that at temperatures of 150 K and below, the tensile strength of water ice is much lower than previously expected (Gundlach et al. 2018a; Musiolik & Wurm 2019). Haack et al. (2020) extended these experiments and investigated different mixtures of dust and water ice for their suitability as comet analogs and found that the tensile strength of a mixture is dominated by the component with the highest tensile strength. In this work, we use these mixtures to study themorphological evolution of samples in a vacuum sublimation chamber with the aim of reproducing basic morphological structures observed at the surface of 67P. In our experiments, we insolated samples, which were composed of water ice and nonvolatile dust particles in different ratios. We took advantage of the very low tensile strength of spherical water ice and fly ash particles that are mixed together and cooled below 150 K (Haack et al. 2020; Kappel et al. 2020). We also allowed vertical and horizontal mass transport of the sample material by the omission of lateral sample boundaries. The intensity of the insolation was varied and the angle of incidence could be set either vertical or horizontal relative to the surface of the sample. We focused on the conditions under which the sublimation of water ice starts to significantly change the sample texture. Alterations of the sample morphology were analyzed and checked for their relevance with respect to cometary surfaces. We find that the resulting morphological features are dependent on the composition of the samples.
Motivated by reproducing the morphology of cometary surfaces with analog materials, we describe scaling of cometary environments to the laboratory and experimental setup in Sect. 2. In Sect. 3, we present our results and discuss them in Sect. 4. Finally, our analyses are summarized in Sect. 5.
Characteristics and chemical composition of components used to simulate cometary materials.
2 Methods
2.1 Selection of materials
We decided to investigate comet analog materials consisting of binary mixtures of a volatile and a refractory component. This not only keeps the complexity of the experiments within limits but also allowed us to investigate the influence of individual parameters on the morphology after sublimation (e.g., dust-ice ratio, insolation direction).
We used polydisperse water ice spheres with an average radius of 2.4 μm (Table 1) as the volatile component of the analog material. This is a first grade approximation since H2O dominates the amount of volatile materials in 67P (Hässig et al. 2015). Other volatiles such as CO2 or CO account for only up to 15 mass% abundance relative to H2O (Bockelée-Morvan et al. 2016; Läuter et al. 2018; Biver et al. 2019). Even when H2O dominates, CO2 and CO ices might play key roles in the activity at large heliocentric distances where water does not sublimate. Our approximation is a first step and other ices will be introduced in future work to see if this makes differences or not.
We used dust as refractory material, whereby a compromise between physical and chemical accuracy had to be found. We decided to use spherical fly ash particles. These have the advantage of not consisting of pure amorphous SiO2 as in previous experiments, but rather they correspond to the more mineralic composition of plagioclase (Table 1). The fly ash particles are polydisperse and of a similar size as the water ice particles used (Fig. 1). Additionally, it is possible to produce samples with a very low tensile strength with these spherical particles (Haack et al. 2020)to simulate the low tensile strength of cometary materials (Groussin et al. 2015; Attree et al. 2018). The filling fraction of the samples describes how much free space is in a volume filled with particles and is with ~ 0.4 (Fig. 2) higher than observations of 67P suggest (Groussin et al. 2015; Attree et al. 2018; O’Rourke et al. 2020). In the experiment, the higher filling fraction would lead to more interparticle bonds and thus a higher tensile strength. However, this effect may be reduced by the spherical shape of the particles that reduces interlocking of realistically angular particles and would compensate for their limited freedom of movement (Haack et al. 2020; Kappel et al. 2020). Although olivine and pyroxene may be more suitable cometary refractory analog materials, the difficulties in acquiring these materials in a micrometer-sized spherical shape were disproportionate for this work. Angular particles, however, would greatly increase the tensile strength of the samples (Haack et al. 2020) and could prevent the alteration of the sample morphology during the sublimation experiment.
Organic materials are also important components of comets (Sandford et al. 2006; Capaccioni et al. 2015; Goesmann et al. 2015; Raponi et al. 2020). However, in this series of experiments, we have omitted organic components in order to capthe complexity of our experiments to be able to attribute a change in morphology to the variation of one individual parameter. The results can be used as a basis for further experiments with more complex sample compositions.
 |
Fig. 1 Electron-microscopy images and size distribution of the particles used in our experiments. The images of spherical fly ash in panel A and water ice particles in panel B are at the same scale (modified from Haack et al. 2020). Panel C presents thecomparable cumulative size distributions of fly ash (red dots) and water ice (blue diamonds). |
 |
Fig. 2 Filling fractions and tensile strengths of different water ice-fly ash mixtures. Pure ice corresponds to 0 vol% on the left, and therespective pure fly ash to 100 vol% on the right. The error of the water ice-fly ash mixing ratio originates from the uncertainty as to the ice mass determination. |
2.2 Particle scaling
A major challenge with experiments in the laboratory is Earth’s gravitational acceleration, which is higher, by order of magnitudes, than the ~2 × 10⁻⁴ m s−2 of comet 67P (Agarwal et al. 2016). Therefore, particles at the surface of the comet are subject to much less gravity and the importance of cohesion between particles is significantly increased (Scheeres et al. 2010; Skorov & Blum 2012; Sánchez & Scheeres 2014). Bischoff et al. (2019) present a model according to which decimeter-sized particles on the surface of 67P are subject to approximately equal cohesive and gravitational forces. Between particles smaller than this threshold, the cohesion is dominant; for larger particles, gravity becomes more important. Previous studies have suggested that comets are formed of up to centimeter-sized pebbles (Zsom et al. 2010; Blum et al. 2014, 2017; Kretke & Levison 2015; Fulle et al. 2016; Lorek et al. 2018). Therefore, cohesive forces should dominate on a comet. Tosimulate processes in the laboratory that are comparable to processes on cometary surfaces, a way to reduce the influence of gravity compared to cohesive forces on the experiment must be found. According to Bischoff et al. (2019), on Earth, the threshold between gravitational and cohesive dominance is a particle radius of ~35 μm. To significantly reduce the relative importance of gravity and to ensure the dominance of cohesive inter-particle forces, the particle radius used in the experiment must be significantly below this size. Water ice and fly ash particles fulfill this criterion, but their cohesion with respect to 67P must be determined.
Images obtained during the Rosetta mission at 67P show complex morphologies, such as cliffs, cracks, or mass movements (Thomas et al. 2015b; Pajola et al. 2016b; El-Maarry et al. 2019), which are morphologically similar to those on Earth. This could indicate that between particles the ratio of cohesive forces and the comet’s gravity is comparable to the ratio between these forces on Earth, even if they differ greatly in absolute numbers. If the cohesion forces on a comet were much more dominant than on Earth, exotic structures such as extreme overhangs or cave-like structures could be expected at the comet’s surface, which would collapse immediately under Earth’s gravity if made of the same material. On the other hand, if gravity was much more dominant, the observed cliffs and boulders would be unstable (Kappel et al. 2020) and the comet’s surface would be much smoother in general. Using this approach, Groussin et al. (2015) have suggested that the ratio of cohesive and gravitational forces at 67P corresponds to that of weak rocks on Earth on a macroscopic scale. We use this suggestion and assume that the ratio between gravity and cohesion on 67P and on Earth is comparable and thus as follows:
 (1)
(1)
With given gravitational forces
 (2)
(2)
of particles on 67P and Earth and the known cohesion
 (3)
(3)
of particles used in the laboratory (Haack et al. 2020), we were able to estimate the corresponding particle size on 67P. In these equations, r is the reduced radius of the particles, ρ is the particle density, g is the gravity acceleration, and γ is the surface energy per unit area. In our experiments, we used mixtures of water ice and fly ash particles with a mean radius of about 2.4 μm (Table 1). According to the used approximation, the water ice and fly ash particles in the experiments reflect millimeter-sized particles on 67P. This agrees well with the model of Bischoff et al. (2019) and is in line with the size of hypothesized pebbles of which comets may have been formed initially (Lorek et al. 2016; Blum et al. 2017). Transferred to macroscopic scales, a 2.5 cm high sample in the sublimation chamber would represent a 10 m-high object on 67P.
2.3 Energy scaling
The scaling of the particle size in the laboratory was intended to increase cohesive inter-particle forces with respect to gravity. As a result, the force that is required to separate the particles from each other and to change the sample morphology was also increased compared to the actual inter-particle cohesive force on the comet. In our experiments, this separating force is the near-surface pressure drag, caused by the vapor pressure of sublimating water ice. To transport single particles or larger aggregates away from their initial positions on the sample’s surface, the pressure drag has to exceed the cohesive forces between the particles. Therefore, the applied energy to create the pressure drag in the experiment must be scaled with the particle cohesion to simulate realistic pressure drag-cohesion ratios.
As a first step, we estimated the surface temperature of 67P as a function of its heliocentric distance. The energy balance of insolation and sublimation is given by the Stefan–Boltzmann law plus a term for the sublimation heat flux, derived from Hertz–Knudsen (Kührt & Keller 1994)
 (4)
(4)
In this equation, the following notation is used:
As a second step, we assumed equal ratios of pressure drag FD and cohesion FC for 67P and in the laboratory and thus follow:
 (5)
(5)
The pressure drag FD results from the vapor pressure (Panale & Salvail 1984; Gundlach et al. 2011) on the particle cross section
 (6)
(6)
With the particle radius r of the analog material, the calculated surface temperature T of 67P from step one, and the cohesion of 67P and the samples, we determined the temperature-dependent gas drag in the laboratory.
The fly ash albedo a was determined to be 0.35 on average in previous measurements. This value was also used as an approximation for the ice-dust mixtures, since the albedo of an ice-bearing sample is mainly determined by the dust component (Chýlek et al. 1983; Clark & Lucey 1984; Oehler & Neukum 1991). Thus the generally low albedo of 67P of 0.06 (Ciarniello et al. 2015) was considered in this scaling and compensated for by a higher energy input. Then we used the temperature derived in Eq. (4) to calculate the insolation intensity in the laboratory.
For our spherical water ice particles, which are mixed with dust particles, we estimated an insolation flux of ~ 1 solar constant in the laboratory to simulate a heliocentric distance of 4 AU in our experiments. This was approximately the distance to the Sun, when the Rosetta spacecraft reached 67P and monitored activity at the surface (Tubiana et al. 2015). The maximum of solar radiation to the surface of 67P is reached at its perihelion at 1.24 AU. This would transform into an insolation flux of about 33.6 solar constants in the laboratory to simulate the cohesion-pressure drag ratio. However, this insolation flux was not feasible with our experimental setup.
| Cs | solar constant, |
| R | heliocentric distance, |
| a | albedo, |
| ϵ | emissivity, |
| σ | Stefan–Boltzmann constant, |
| T | temperature, |
| H | latent sublimation heat, |
| Pv | vapor pressure, |
| kB | Boltzmann constant, and |
| m | molecule mass. |
2.4 Sample preparation
We conducted a series of sublimation experiments with samples that were composed of water ice and fly ash in different mixing ratios (Haack et al. 2020). These were inter-mixtures, which means that individual particles consisting of a single component were mixed together. Water ice spherules represent the volatile content of a comet and fly ash particles represent the refractory dust components. These mixtures were used to test the dependence of the sublimation of a sample on (a) the ice-dust ratio of the mixture and (b) the direction of the insolation flux.
The water ice particles were produced with a water droplet dispenser that sprays mist into a Dewar vessel filled with liquid nitrogen (Gundlach et al. 2018b; Haack et al. 2020). The water droplets freeze, forming a suspension of polydispersespherical water ice particles and liquid nitrogen, and they eventually sink down to the bottom of the Dewar vessel. The amount of water ice in the suspension was determined by using Archimedes’ principle. The weightsof a defined volume of pure liquid nitrogen and of liquid nitrogen with suspended water ice were measured. The densities of liquid nitrogen and water ice are known and allowed the calculation of the mass of water ice in the suspension from the weight difference between both components. Fly ash was directly weighed with a scale.
We produced five different ice-dust mixtures (66, 50, 33, 25, and 20 vol% water ice) by adding predefined amounts of dust into the suspension of liquid nitrogen and a known amount of water ice. This corresponds to dust-ice mass ratios of ~ 1.2, 2.4, 4.8, 7.3,and 9.7, similar to those expected for the nucleus of a comet (Rotundi et al. 2015; Herique et al. 2017; Fulle et al. 2017, 2018; Pätzold et al. 2018). The liquid nitrogen, water ice, and dust particles were mixed manually with a ladle to obtain a homogeneous suspension. Then, the mixtures were filled into a metal cylinder with an inner diameter of 25 mm, which was placed vertically on a permanently nitrogen-cooled sample holder (Fig. 3). The viscosity of the mixture in the cylinder was high enough that ice and dust could no longer segregate due to their different densities. The liquid nitrogen as a coolant was necessary to prevent sintering of the ice particles (Kuroiwa 1961; Gundlach et al. 2018a). Without cooling during the sample preparation, stiff sinter necks could form between ice particles and would lead to higher values for the tensile strength of the sample materials. After the liquid nitrogen of the suspension slowly evaporated from inside the metal cylinder, the cylinder was carefully lifted up. As a result a cylindrical sample of water ice and dust remained on the sample holder. Its diameter was the same as the inner diameter of the cylinder (25 mm) and the height varied between 20 mm and 25 mm. A slow and steady evaporation of the liquid nitrogen was necessary to avoid the formation of cavities within the sample and to reduce their formation at the contact surface with the cylinder. During the preparation, the samples were not mechanically compressed and were held together by their own cohesion. After removing the metal cylinder, the cooled sample holder with the sample on top was quickly placed into the precooled vacuum sublimation chamber and ready for the sublimation experiment.
 |
Fig. 3 Preparation of the samples. Panel A: metal cylinder (left) and sample holder (right) that were used to prepare the samples. The green cable with the connector belongs to one of the thermocouple sensors, which was used to monitor the sample temperature during the experiment. Panel B: the metal cylinder was plugged onto the sample holder and filled with a suspension of liquid nitrogen, water ice, and dust particles. To ensure that the setup was constantly cooled while the liquid nitrogen evaporated from the sample mixture, the outer volume of the sample holder was also filled with liquid nitrogen. |
2.5 Tensile strength
Before we started the sublimation experiments, we performed a series of measurements to determine the tensile strength of the samples. Weprepared 15 samples, each of various ice-dust mixtures in the manner described above, and made sure that all nitrogen had evaporated from the samples. We then determined their weight and volume and were able to calculate the filling fraction Φ of the samples. Westarted with a water ice content of 100 vol% and reduced it to 0 vol%. The filling fractions of all investigated mixing ratios were between 0.40 and 0.46 (Fig. 2). According to Blum et al. (2006), the upper limit of the tensile strength σ of granular matter is
 (7)
(7)
With the values for the surface energy γ of water ice-fly ash mixtures at liquid nitrogen temperatures (Haack et al. 2020) and the particle radius r, we could determine the tensile strength of the samples. Since pure water ice or fly ash are not suitable as comet analog material, we used mixtures with a water ice content between 66 vol% and 20 vol% for the sublimation experiments. This gave tensile strengths of water ice-fly ash mixtures between 930 ± 60 Pa and 400 ± 10 Pa, respectively (Fig. 2).
2.6 Sublimation experiments
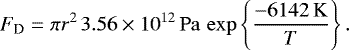
For our experiments, we used a cylindrical vacuum sublimation chamber with an inner diameter of 25 cm and a height of 80 cm (Fig. 4). Before the start of the experiment, the chamber was closed, cooled down to about 110 K, and flooded with argon. The argon ensured the absence of atmospheric moisture inside the chamber when it was opened to place the sample inside. This prevented altering the sample before the experiment started. To ensure constantly low sample temperatures, which are similar to those of a comet (Kührt 1984), and to prevent thermal background radiation, an actively cooled shield system was used. This cooling shield is a rectangular metal housing with a side length of 10 cm and with a firm connection to a circuit for continually circulating liquid nitrogen. The cooling shield is coated black on the inside to prevent reflections and has two windows for insolation and observation of the sample inside (Fig. 4).
Immediately after preparation, the sample was placed inside the cooling shield. Thereby, the sample holder was firmly screwed to the cooling shield and temperature sensors were connected to the sample holder. Subsequently, the chamber was closed and the atmospheric pressure inside was reduced to ~10−7 mbar. To ensure that the measurements were performed in a controlled environment, the pressure inside the chamber and the temperatureat four positions (sample, cooling shield top and bottom, and nitrogen input) were monitored in parallel (Fig. 5). From the beginning of the placement of the sample, a camera with a resolution of 3000 × 2000 pixels was focused at the sample through a window in the sublimation chamber and monitored the sample at a rate of one image per second.
After the pressure inside the chamber had reached its operating value of ~10−7 mbar, we started to insolate the sample. We used a halogen lamp with variable intensity and a simple mirror and lens system to focus the light on the sample. We also distinguished between insolation vertically to the top of the sample or horizontally to the side. This was implemented to investigate possible differences in material transport. During the experiments, the light source insolated the samples constantly in one direction.
In a first series of experiments, we combined different mixing ratios with horizontal or vertical insolation. For this series of measurements, we chose an insolation flux of ~1 solar constant, which corresponds to a heliocentric distance of 4 AU, following the scaling relations. In a second series of experiments, we increased the insolation flux to about 3 solar constants, which represents a heliocentric distance of 3.1 AU. The insolation of a sample lasted up to 20 h. After that time, the active cooling had to be stopped to replenish the liquid nitrogen supply. At the end of the experiment, the degree of alteration of the samples’ surface was analyzed via the camera observations and related to different material compositions and levels and directions of insolation.
3 Results
The experiments of the first series with an insolation flux of about 1 solar constant (corresponding to a heliocentric distance of 4 AU) resulted in no visible alterations of the samples’ morphology. Even the samples with the highest fraction of 66 vol% water ice showed no signs of activity under horizontal or vertical insolation, respectively. The samples were removed from the sublimation chamber after about 20 hours. The strength of the samples had increased significantly. They could be gripped with crucible tongs without damaging them. More detailed measurements of the exact tensile strength, porosity, among others, were not feasible because the room temperature and humidity in the laboratory were too high. As a result, frost immediately formed on the surface of the samples and additional sintering of the particles could not be avoided (Kuroiwa 1961), which would have falsified possible measurement results. After heating up the sample remains to room temperature, it was observed that the subsequently melting ice in the interior of the samples was preserved and did not sublimate.
The second series of experiments with an insolation flux of ~3 solar constants, which correspond to 3.1 AU, resulted in a broad variety of activities at the samples’ surfaces. In addition to different ice-to-dust ratios, vertical and horizontal insolation resulted in different surface activities during the observation periods. The temperature and pressure inside the cooling shield were monitored continuously. In all measurements, the internal sample temperatureremained below 150 K and short-term changes in pressure could be attributed to events that changed the sample’s surface (Fig. 5).
 |
Fig. 4 Setupof the sublimation experiments. Panel A: cylindrical vacuum sublimation chamber with two observation windows. One is located on the top and one on the lateral side of the chamber. In the configuration shown, the light enters the chamber from above. Panel B: view through the lateral observation window into the inside of the vacuum sublimation chamber. The sample holder is firmly attached to the cuboid cooling shield. The object visible inside the cooling shield is the sample insolated from above. The green cables in the chamber belong to the different temperature sensors that monitor the temperature of the sample and the experimental setup. A camera is directed at the sample from outside. |
 |
Fig. 5 Two examples of the monitored pressure and temperatures in the chamber for two samples with 25 vol% water ice, each. The recordings were made every second from the beginning of the experiment to its end. Panel A: the insolation with ~ 3 solar constants was vertical from above. When the sublimation activity of the sample stopped after about 3 h, the pressure and temperatures remained stable until the end of the experiment. Panel B: the insolation was horizontal from the side. The temperatures of the sample and setup remained approximately stable. The pressure curve shows two short-term increases after 3 and 5.5 h, which can be attributed to two collapse events on the sample. The sample temperature increased at ~ 0.5 h after the remainder of liquid nitrogen vaporized from the sample. |
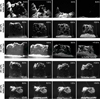 |
Fig. 6 Five vertically insolated samples with different dust-to-water ice ratios at an insolation rate of ~ 3 solar constants. The image series show how the sublimation activity reduces with a decreasing water ice content (online movies). At a 66 vol% water ice content, several ejected particles are visible as elongated bright dashes (in the panels with a timestamp of 0.5 h and 6.0 h) and the whole sample has disappeared after about 6 h of continuous sublimation. The series of pictures with a 33 vol% and 50 vol% water ice content show the erosion of lateral surfaces, the formation of a talus, and the granular structure of the sample material. The first two images of the series with 33 vol% water ice appear brighter because the filter in front of the camera, which reduces the brightness, was not installed and was added during the experiment. The shape of the samples with a 25 vol% and 20 vol% water ice content changed rather in single events (ejections) and did not experience any further visible changes after about 3 h (see Fig. 5A). |
3.1 Vertical insolation
We analyzed samples with a 66–20 vol% water ice content under vertical insolation flux of ~ 3 solar constants. The results could be summarized into three groups, depending on their ice contents.
3.1.1 66 vol% water ice content
We started the experiments with a high water ice content of 66 vol%. Most noticeable was a fast and intense reshaping of the sample’s surface. The sublimating water ice created a permanent and distinctly visible stream of particles that detached from the surface and were ejected away from the sample (Fig. 6). No ice-free layer of dust was able to form at any insolated area of the sample. A change in the albedo could not be observed either. As a result, fresh sample material was always present on the surface and was exposed to progressive sublimation. The texture of the sample material appeared granular with a grain size in the submillimeter range. The observed grains were larger than the initially used ice and fly ash particles, which accumulated in these larger aggregates. After about six hours, the constant sublimation process had progressed so far that all water ice had sublimated from the sample and the majority of refractory dust was transported away.
During the evolution of the surface exotic structures, spikes, and extreme overhangs formed, which only collapsed after most of the material had been transported away (Fig. 7). These roughly horizontal overhangs reflect the dominance of cohesive forces compared to gravity within the sample material.
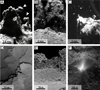 |
Fig. 7 Comparison between laboratory results and observations on 67P. Panels A–C show details of different vertically illuminated samples from Fig. 6 during the phase of active sublimation in the laboratory. Panels D–F show images of the in situ surface of comet 67P to compare them with the corresponding lab results. Panel A: exotic morphology of the sample with a 66 vol% water ice content. The arrows indicate extreme overhangs, which did not collapse immediately. Panel B: shown is an enlarged section of the sample with a 50 vol% water ice content. The dotted line separates the sample wall (upper area) from the talus of loose debris (lower area). The granular structure of the sample material is clearly visible. The micrometer-sized individual particles (see Fig. 1) form aggregates of up to 1.5 mm in size and frequently remain intact when they detach from the sample and accumulate on the talus. This image represents the granular structure of all investigated samples. Panel C: the sample with a 20 vol% water ice content in the early phase of the experiment. Several fragments up to a millimeter in size were detached from the sample’s surface and ejected in single outburst events. Panel D: a detailed image of the surface of 67P taken by the Philae lander. It shows the actual surface of 67P without extreme overhangs as seen in panel A (ROLIS image derived from Schröder et al. (2017)). Panel E: a cliff on the comet with a talus of debris material that is reminiscent of laboratory results in panel B. Panel F: an outburst plume at the surface of 67P. Agarwal et al. (2016) describe meter-sized boulders that were ejected during these outbursts. Image credits: ESA/Rosetta/MPS for OSIRIS Team MPS/UPD/LAM/IAA/SSO/INTA/UPM/DASP/IDA. |
3.1.2 50 vol% and 33 vol% water ice content
As the water ice content of the samples decreased to 50 vol% and 33 vol%, the kinetics of surface alteration decreased significantly. At the beginning of the sublimation experiments, particles were continuously ejected from the sample. But the particle ejection frequency and transport range were significantly reduced, compared to samples with a 66 vol% ice content. Unfortunately, the setup did not allow us to quantify this more precisely. After 15–20 min, the phase of active ejection of particles ended for both samples. Material, which was detached from the sample’s surface, predominantly fell down because of gravity. The alterations of the samples were mainly limited to their vertical walls. This led to a continuous decrease in the sample’s diameter. The loose and ice-depleted material accumulated around the base of the sample and formed a talus of debris (Figs. 6 and 7). This talus consisted of aggregates up to 0.5 mm in size, consisting of dust particles and small amounts of water ice. The granular structure visible at the talus could also be observed directly in the ice-dust mixture on the sample’s surface. Some aggregates reached sizes of up to 1.5 mm, but decayed into smaller fragments as soon as they fell off the sample’s surface. In the submillimeter range, the surface appeared very rough. With the particle scaling from Sect. 2.1, the observed aggregates would correspond to boulders of some decimeters on the surface of 67P. In contrast to the diameter, the height of the two samples remained stable. At the end of the experiments, a thin layer of dust was observed on the horizontal surface layer of the samples.
The morphological development that both samples underwent seems to be comparable, but it proceeded on different timescales. The surface of the sample with 50 vol% water ice changed continuously until the end of the experiment. In contrast, the evolution of the sample with 33 vol% water ice slowed down noticeably and came to an end after 11 h. Although the sample was observed for another 7 h, no further alterations on the surface were observed.
After the remains of the samples were removed from the sublimation chamber, large amounts of water ice were noticed in the center of the remaining samples and some amounts were in the talus material. Additionally, the ice-rich center of the remaining samples was significantly solidified, compared to the start of the experiments, when the samples were extremely fragile. With our setup, it was not possible to determine the amount of ice in the remaining material because it began to thaw after it was removed from the chamber.
3.1.3 25 vol% and 20 vol% water ice content
The samples with a water ice content of 25 vol% and 20 vol% showed a very similar development. Ejected particles were observed in the first minutes of the experiments and then only sporadically. Samples with both mixing ratios lost limited amounts of material at their directly insolated top surface. A visible loss of material on the lateral surfaces could not be observed. The constant low pressure in the chamber also shows that the sample did not lose any further volatile material after the end of the limited surface erosion (Fig. 5A).
A few minutes after the beginning of the experiment with the 20 vol% water ice sample, some major outburst events from the top surface were observed. A large number of up to millimeter-sized fragments detached and were transported away explosively (Fig. 7). However, these outburst events were limited to the initial phase of the experiment and did not occur during its further course. Fresh sample material became visible where alterations on the sample’s surface occurred. It appeared very similar to the other mixtures and showed a granular structure in the submillimeter range.
Even after prolonged insolation, no further surface changes were observed in either sample type after 3 h. Comparable to the samples with a higher ice content, the remains of the samples kept their ice content and were strongly solidified when they were removed from the sublimation chamber.
3.2 Horizontal insolation
Analog to experiments with vertical insolation, we analyzed samples with a 66–20 vol% water ice content under horizontal insolation flux of ~3 solar constants.
3.2.1 66 vol% water ice content
At the beginning of the insolation, the sample with a 66 vol% water ice content showed intense activity at its surface. Particles and macroscopic aggregates in the submillimeter range detached from the sample and were ejected from its surface. During this process, the vertical and smooth surface of the sample evolved to an irregularly rough surface and a thin layer of dust did accumulate. During this process the activity decreased continuously, and particles and aggregates were ejected less frequently and less far. After about 4 h, the initially vertical sample wall was tilted and showed only sporadic signs of morphologic alterations. At that time, the sample had lost more than half of its initial material. After an additional 7 h in the sublimation chamber and with a nearly unchanged morphology, the upper part of the sample collapsed spontaneously. The sample material that remained created a cliff-like structure (Fig. 8). The debris accumulated at the base of the sample and decayed into fine dust and aggregates whose grain size did not exceed one millimeter. When trying to examine the remaining sample material at the end of the experiment, we found that the debris appeared almost free of water and the slightest vibration or air-draft would immediately change the position and shape of the remains. Within the “cliff" and at the bottom of the sample, a substantial amount of water ice was still present. However, it could not be determined whether the total ice-to-dust ratio had changed significantly within the remaining sample material.
3.2.2 50 vol% and 33 vol% water ice content
At the start of the insolation of the sample with 50 vol% ice and dust, respectively, a significant number of particles were ejected from the surface. After a few minutes, the distance covered by the particles decreased significantly and they accumulated at the base of the sample. Over the course of the experiment, a talus of debris grew on the insolated side of the sample (Fig. 8). The degree of activity and number of ejected particles remained relatively constant for the first 6 h,then activity slowed down significantly and came to an end after a total of 12 h. At that time, the accumulated debris material covered approximately the lower half of the sample. The upper half of the sample appeared to be covered by a thin layer of ice-depleted dust, but underneath this layer the original ice-dust ratio was preserved. The height of the sample and the side facing away from the light remained unchanged throughout the experiment.
The results of the experiment with 33 vol% ice strongly resemble the ones of the experiment with 50 vol% ice. However, the talus of accumulated material at the foot of the sample developed significantly less and the alterations on the sample’s surface came to a complete end after 5 h.
The morphological development of these two samples is very similar to results with vertical insolation. Samples of both series of experiments showed the same granular structure and a talus formed for both types at their base.
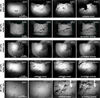 |
Fig. 8 Evolution of the five different ice-dust mixtures with horizontal insolation. The occurrence of collapse events with different sample compositions is noticeable (online movies). Samples with a 33 vol% and 50 vol% water ice content show a continuous alteration of their shape until the end of the sublimation activity and formation of talus at their base. At a 25 vol% and 20 vol% water ice content, single events occurred in the form of cliff collapses exposing fresh material on the surface (see Fig. 5B). After 5.5 h and 3 h, respectively, no further alterations on the surface were visible. The bright areas in the upper right corner of the images with 20 vol% water ice are reflections of a light source in the laboratory on the observation window of the sublimation chamber. |
3.2.3 25 vol% and 20 vol% water ice content
The sample with a 25 vol% water ice content showed little ejection activity at the beginning, which came to an end after a few minutes. The sample morphology did not change continuously as observed on previous samples, but two collapse events occurred. The first one after 3 h was limited to a small area, but during the second one after 5.5 h the whole insolated area collapsed. Both events can be read off well from the changes in the pressure curve (Figs. 5 and 8), because fresh volatile-containing material was exposed to the surface. This led to an increase in sublimation activity for about 40 min. After the second collapse, the surface of the sample was significantly roughened and became irregular and ejection activity occurred again, and it decreased after about 30 min. From that point on, the morphology of the sample did not alternate until the end of the experiment.
The sample with 20 vol% water ice evolved similarly to that with a 25 vol% water ice content. At the start of the experiment, only a few particles were ejected from the insolated side. After about 2 h, this side collapsed and left a significantly irregular surface. After some subsequent minor alterations of the sample morphology, no additional changes were observed for the remainder of the experiment.
4 Discussion
The following sections discuss the grouped results of experiments with an insolation flux of about three solar constants (3.1 AU). Experiments with about 1 solar constant (4 AU) showed no surface alteration and are not discussed.
4.1 Vertical insolation
4.1.1 66 vol% water ice content
Samples with a water ice content of 66 vol% are similar in porosity (0.56) and density (0.57 g cm−3) to 67P (Hornung et al. 2016; Langevin et al. 2017; Pätzold et al. 2018). However, the morphological features and the speed at which these were formed indicate that the high content of volatiles is unlikely to be present at the surface of 67P. The vapor pressure of the sublimating ice entrained all the detached dust particles, so that no ice-depleted cover layer could form. On the entire surface of the sample, fresh and ice-rich material was exposed for the full duration of the observation. This is in contradiction to Deep Impact and Rosetta observations, which showed discrete patches of volatile-rich material on an overall ice-depleted surface (Sunshine et al. 2006; Capaccioni et al. 2015). Furthermore, the high water ice content significantly increases the tensile strength of the sample (Haack et al. 2020). This results in the formation of exotic structures on the sample’s surface that do not resemble the 67P morphology (Fig. 7). Extreme overhangs and nearly horizontal spikes with material accumulations at their free ends are an expression of very high cohesion between the particles, which was not observed on a comet. This experiment provides further indication that the near-surface composition of comets is dominated by refractory materials and not by volatile ices (Herique et al. 2017; Fulle et al. 2018; Pätzold et al. 2018).
4.1.2 50 vol% and 33 vol% water ice content
The increased dust content in samples with a 50 vol% and 33 vol% water ice content reduced the sublimation activity significantly. After 15–20 min, a layer of dust had formed on the horizontal top of the samples and prevented fresh ice from being insolated. Therefore, the height of the samples decreases only slightly during these experiments. This process was already observed in earlier experiments(e.g., Grün et al. 1993; Kührt & Keller 1994; Lämmerzahl et al. 1995) and could be a source of dust thatcovers substantial parts of the surface of 67P (Thomas et al. 2015a; Lai et al. 2016). It must be noted that significant amounts of dust are redeposited on 67P and substantial dust blankets do not have to have formed in situ on the comet’s surface (Kramer & Noack 2015; El-Maarry et al. 2016; Lai et al. 2017; Cambianica et al. 2020).
The material loss of the samples occurred mainly on their vertical surfaces and made the granular structure of the samples visible. These grains can easily be removed against cohesion and gravity via pressure drag forces and their size scaling to cometary conditions can be reproduced very well in in situ observations of millimeter- to decimeter-sized particles of 67P (Mottola et al. 2015; Rotundi et al. 2015; Fulle et al. 2016; Ott et al. 2017). In fact, the surface structure also resembles in situ observationsfrom Rolis on Philae. Schröder et al. (2017) and Otto et al. (2020) describe the morphology of the cometary material on an actual millimeter scale. Our experiments are scaled to larger sizes, but the in situ images show cohesive material which we also produced. Despite the vertical walls not being directly insolated in our setup, the small amount of energy that reached the vertical walls was sufficient to sublimate the ice, which has a higher surface energy than fly ash(Haack et al. 2020) and acts as “glue.” Diffuse reflections from inside the chamber were unlikely due to the black coating of the inner cooling shield. With the reduced amount of ice, the tensile strength of the sample material decreased and ice-depleted material detached from the surface. Due to the high incidence angle at which the vertical surfaces were insolated, the incoming energy was not sufficient at ejecting the dust particles and aggregates as well as the talus that formed around the sample. Over time, the diameter of the sample decreased while its height remained mostly constant. This process has been suggested to be at work on 67P by Vincent et al. (2016).
This shows that the durability of an insolated object on a cometary surface depends not only on its material, but also on its shape if some illumination directions are obstructed. At vertical walls, the formation of stable dust layers is limited, so that local morphological features (boulders, cliffs, etc.) on a comet’s surface can become the starting point of regressive erosion. With these two experimental setups, we could reproduce retreating scarps and boulder movements at taluses observed on comets 9P or 67P (e.g., Thomas et al. 2013; El-Maarry et al. 2017). The erosion only comes to rest when irregular surfaces are smoothed and covered by an ice-depleted layer of dust. This could be reproduced in the sample with 33 vol% water ice when after about 11 h substantial parts of the lateral surface were covered by the talus and enough dust had accumulated on the meanwhile nonvertical surfaces to prevent progressive erosion.
In 67P, fractures evolved within the cometary material to a length of up to several hundred meters (El-Maarry et al. 2015; Poulet et al. 2016) and formed networks of polygons. These polygons are predominantly 1–5 m in width, but they can exceed 13 m (Auger et al. 2018). They form when a near-surface layer is hardened by the sublimation and condensation of volatile materials (Spohn et al. 2015; Knapmeyer et al. 2018), and tensions can build up in the hardened layer. After the sublimation experiments, we observed the hardening of the samples’ interiors, but we did not simulate diurnal cycles. Therefore, the samples were not exposed to a temperature-dependent volume change and subsequent mechanical stress. This may have prevented the formation of crack systems.
It is also possible that the samples in the laboratory were too small to develop a stress field sufficient to create visible fractures in the samples.
4.1.3 25 vol% and 20 vol% water ice content
The granular structure of the sample material with 25 vol% and 20 vol% water ice appeared to be very similar to that of samples with a higher water ice content. However, the small changes in the morphology of the samples show that the vapor pressure was no longer sufficient to continuously detach and eject particles (Finson & Probstein 1968; Farnham et al. 2007). The high dust content prevents a simple escape of gaseous water, so that a higher vapor pressure can build up near the sample’s surface. This pressure is eventually released in an outburst event, entraining substantial parts of the surface. This could be interpreted as an analogous process of spontaneous jet formation on the rough surface of 67P (Tubiana et al. 2015; Vincent et al. 2015a,b). In the experiment, this process is suppressed after a few minutes by a cover layer of dust, which protected the underlying water ice from sublimation (see Grün et al. 1993; Kührt & Keller 1994).
This series of experiments showed that the type of sublimation activity and the morphologic appearance of the erosion process are depended on the volatile content. When the volatile content is large, the mass loss is fast but continuous (Fig. 6). As the dust content increases, the mass loss per time decreases and single but larger ejection events occur. This shows that sublimation activity is not necessarily a slow and continuous process, just as observed for 67P (Tubiana et al. 2015; Vincent et al. 2016). It is possible to suggest that the different outburst and activity patterns on 67P could also be attributed to a heterogeneous volatile content in the comet’s material with the jet occurring in potentially more dust-rich areas. Vincent et al. (2016) actually attribute outbursts to areas with steep scarps. We find that the spatial distribution of outburst locations on the nucleus correlates well with morphological region boundaries, especially areas marked by steep scarps or cliffs.
4.2 Horizontal insolation
Analog to the experiments with vertical insolation, the ice-dust mixtures were insolated horizontally in a series of sublimation experiments. Despite their identical composition, the morphology of the samples developed differently than under vertical insolation.
4.2.1 66 vol% water ice content
The sample with 66 vol% water ice showed a similarly high sublimation activity at the beginning of the experiment as under vertical insolation, but this activity decreased after a short time. The vertical wall quickly lost material, became very rough, and eroded more rapidly at the free surface at the top. Therefore, a thin layer of dust could more easily form on less intensively insolated areas. This prevented rapid and complete material loss. After 4 h, a thin dust layer had formed and only a few particles and aggregates were ejected. Due to the generally low dust content in the sample, the dust layer accumulated slowly, but was sufficient to prevent the complete sublimation of the ice.
After 11 h in the chamber, the upper part of the sample collapsed (Fig. 8). This shows that despite the thin protective dust layer, water sublimated from the sample material below. A comparable process of sublimation of volatiles through the porous mantle of cometary nuclei was reviewed by Belton (2010) and observed on 67P (Oklay et al. 2016). However, the collapse of the sample seems unexpected because remaining water ice in the sample would act as an adhesive. During experiments with vertical insolation, aggregates detached from the sample wall and scaled to a few centimeters to decimeters on a comet. In contrast, the cliff collapse under horizontal insolation in the laboratory would scale to several meters on a comet. In this size range, gravity plays a more important role in the laboratory and on the comet (Sánchez & Scheeres 2014; Bischoff et al. 2019) and subsequentially the ice-depleted cliff collapsed under its own weight.
A further explanation for the reduced sublimation rate compared to vertical insolation could be found in the sample preparation phase. It cannot be completely excluded that at the moment the sample was placed in the chamber, its surface temperature increased above 150 K and the superficial ice particles started to sinter (Kuroiwa 1961; Gundlach et al. 2018a). This would have greatly increased the tensile strength of the sample material and made changes in morphology more difficult. In this case, the cliff collapse would have been unlikely.
4.2.2 50 vol% and 33 vol% water ice content
As under vertical insolation, the samples with a 50 vol% and 33 vol% water ice content altered comparable to continuously receding cliffs and they formed taluses of debris as observed for cometary nuclei (Farnham et al. 2013; Vincent et al. 2015a,b). However, the timescales on which this occurred were different. Due to direct horizontal insolation of the lateral sample’s surface, the sublimation phase was more intense but it slowed down much earlier. This resulted in a faster development of the ice-reduced talus and dust layer. They covered substantial areas of the surface much earlier and prevented further sublimation activity such as the ejection of particles. This explains the paradox that despite direct insolation, the sample became inactive more quickly.
The fact that the samples tended to lose material rather continuously than in larger cliff collapses could be due to their water ice content, which increases the tensile strength (Haack et al. 2020). Also the random internal structure of the individual samples may prevent collapses.
4.2.3 25 vol% and 20 vol% water ice content
The morphological development of the samples with only 25 vol% and 20 vol% water ice was different compared to that with the same volatile content but insolated vertically. The cliff collapses occurred after the insolated area became unstable due to the loss of water by sublimation (Belton 2010). This could not be observed on horizontal surfaces because vertical mass transport is not possible. Therefore, the mass loss of even volatile-depleted samples was enhanced under horizontal insolation compared to vertical insolation. The reactivated release of volatiles after collapse events corresponds to the observationsof 67P where cliff collapses and other mass wasting processes are linked to the local formation of gas jets (Steckloff et al. 2016; Oklay et al. 2016; Vincent et al. 2016). As the activity of the sample ended, its surface appeared very similar to the rough surface of 67P in close-up images (e.g., Vincent et al. 2015a,b; Schröder et al. 2017).
At the end of the experiments, the final morphologies of the different samples were comparable when insolated horizontally. The stable remains of the samples displayed very rough and irregular surfaces, while the fine-grained debris material formed a talus at the bottom of the sample. However, the formation processes were different: from a longer lasting and uniform sublimation activity of samples with high volatile content to an event-dominated and faster ending activity of samples with low volatile content. Since continuous and thus high sublimation rates would let a comet decay quickly and observations of 67P would suggest episodic activity (Tubiana et al. 2015; Steckloff et al. 2016; Vincent et al. 2016), a low near-surface ice content up to 20 vol% seems plausible on a comet.
Despite many similarities between morphologies of laboratory experiments and in situ observations, it must be noted that our comet analog material is a rough approximation of the actual cometary material. Thus, in our setup we completely abstained from using organic materials (Capaccioni et al. 2015; Goesmann et al. 2015; Fulle et al. 2017). However, their influence onthe development of cometary surfaces cannot be underestimated and must be analyzed in future experiments.
None of the sublimation experiments with an insolation flux of ~1 solar constant resulted in visible changes in the sample’s surfaces. According to our scaling, this insolation flux corresponds to a heliocentric distance of the comet of ~4 AU and at this distance 67P already showed activity on its surface (Tubiana et al. 2015). For this discrepancy, the following two explanations are possible. (1) The scaling is not sufficiently accurate and the required energy for a simulated heliocentric distance of the comet was underestimated. (2) The sample mixture does not reflect the composition of a comet accurately enough.
Since the physical correlation between sublimation and van der Waals related cohesion have been well described in previous publicationsas the main suppressor of cometary activity (Chokshi et al. 1993; Kührt & Keller 1994; Scheeres et al. 2010; Skorov & Blum 2012), it is most likely that the reason for the negative results lies within the sample mixture. The increased albedo and the absence of other volatiles and organic material in the laboratory are major differences to the composition of comets possibly reducing the laboratory cometary activity. Nevertheless, the influence of the albedo on the required energy in the laboratory was taken into account in Eq. (4).
A probable explanation for cometary activity at large heliocentric distances is the presence of CO2, CO, and other super-volatile ices (Bockelée-Morvan & Biver 2017; Läuter et al. 2018; Gundlach et al. 2015), which start to sublimate atlower temperatures. Since we only used water ice as volatile, this could shift the sublimation activity of the samples to higher insolation fluxes. Additionally, it is conceivable that the presence of organic material in 67P favors the absorption of energy due to their dark color (Ciarniello et al. 2015) and allows ices to sublimate faster on the comet.
 |
Fig. 9 Schematic and qualitative overview of parameters affecting the alteration of the sample’s surfaces in the experiment. Vertical insolation and high ice content result in a more continuous alteration and increase its duration. Horizontal insolation and high dust content result more often in spontaneous outburst and collapse events and decrease the overall duration of active surface alteration. |
5 Conclusions
The insolation flux required to generate sublimation activity on a sample and thus a cometary surface depends on its content of different volatile materials. Using water ice as the only volatile, it was not possible to generate activity at a distance equivalent to about 4 AU in the laboratory. However, at a simulated heliocentric distance of 3.1 AU, pronounced activity could be generated.
All of the prepared sample mixtures presented a similar granular structure. The dust and ice particles, which were used as analog materials, formed submillimeter- to millimeter-sized aggregates. These aggregates would correspond to centimeter-to-decimeter-sized pebbles on 67P and simulate the predicted granular structure of the comet (Fulle et al. 2016; Blum et al. 2017; Pajola et al. 2016a).
The volatile content of the sample has a major influence on the type of sublimation activity (Fig. 9). Volatile-rich samples are subject to the generally continuous and rapid loss of ice and dust. Due to the low dust content, no uppermost layer of dust forms, or only slowly, which would prevent extensive sublimation by covering fresher material. Simultaneously, the high water ice content increases the tensile strength (Haack et al. 2020) and allows the formation of exotic morphologies such as spikes or extreme overhangs.
When the amount of dust in the samples increases, the activity comes to an earlier end due to an evolving protective layer of dust. At the same time, the activity gets a more episodic character resulting in outburst events or cliff collapses. The resulting water-depleted deposits are less cohesive, but they form very irregular and more stable surfaces compared to volatile-rich materials.
The shape of the surface features and the angle at which they are insolated can partly compensate for the effects of different volatile content. Under vertical insolation, layers of dust can form on horizontal surfaces. These layers remain stable due to reduced gravitational transport processes. Thus the underlying, possibly volatile-rich material remains unaffected by sublimation and the height of a sample or an area on a comet remains largely constant.
This changes with the horizontal insolation of features that allow material to fall down (scarps, pits, etc.). If an ice-depleted layer forms on a steep wall, it collapses when its weight exceeds its cohesion and exposes fresh volatile-containing material. This process can repeat episodically and lead to regressive erosion along a scarp. In this geometry, Earth’s gravity helps to get rid of desiccated dust mantles. This could perhaps mimic the aerodynamic drag of the escaping gas with the loosened dust bodies on the surface.
The erosion comes to an end when the initial scarp develops an irregular or rough shape that no longer permits vertical mass transport. Additionally, the formation of a talus of debris can cover substantial parts of the original morphological feature and protect it from further erosion. This was typical for mixtures with a moderate water ice content.
Our investigations suggest that a volatile content of more than 50 vol% (<2.4 dust-to-ice mass ratio) in the outer layers of 67P is unlikely since the morphological features generated in the laboratory and high sublimation rates were not found in 67P. Due to the generally low activity of samples with a volatile content of 25 vol% (>7.3 dust-to-ice mass ratio) and less, these values are also unlikely, but they cannot be excluded completely. Our experiments based on the morphologic evolution of surface structures suggest that near the surface, a comet possesses dust-to-ice ratios between these limits. The results obtained in the laboratory are most consistent with observations and predictions for 67P (Herique et al. 2017; Fulle et al. 2018; Pätzold et al. 2018). However, further experiments are necessary tostudy, in more detail, the influence of organic matter on the morphological development of cometary surfaces.
Movies
Movie 1 associated with Fig. 6 and 8 ( Horizontal - 20 Vol Ice - 1 Min = 4 H) Access Supplementary Material
Movie 2 associated with Fig. 6 and 8 (Horizontal - 33 Vol Ice - 1 Min = 4 H) Access Supplementary Material
Movie 3 associated with Fig. 6 and 8 (Horizontal - 50 Vol Ice - 1 Min = 4 H) Access Supplementary Material
Movie 4 associated with Fig. 6 and 8 (Vertical - 25 Vol Ice - 1 Min = 4 H) Access Supplementary Material
Movie 5 associated with Fig. 6 and 8 (Vertical - 33 Vol Ice - 1 Min = 4 H) Access Supplementary Material
Movie 6 associated with Fig. 6 and 8 (Vertical - 50 Vol Ice - 1 Min = 4 H) Access Supplementary Material
Movie 7 associated with Fig. 6 and 8 (Vertical - 66 Vol Ice - 1 Min = 4 H) Access Supplementary Material
Acknowledgements
This work was carried out in the framework of the CoPhyLab project funded by the D-A-CH programme (GU 1620/3-1 and BL 298/26-1/SNF 200021E 177964/FWF I 3730-N36). The research project “The Physics of Volatile-Related Morphologies on Asteroids and Comets” is funded by the DLR Management Board Young Research Group Leader Programme and the Executive Board Member for Space Research and Technology. We gratefully acknowledge their financial support and endorsement. Many thanks to I. Büttner from DLR Berlin for sieving the fly ash, to U. Altenberger from the University of Potsdam forproviding SEM images and chemical analysis of fly ash and to M. Neuhaus for providing images of ice particles.
References
- Agarwal, J., A’Hearn, M. F., Vincent, J.-B., et al. 2016, MNRAS, 462, S78 [CrossRef] [Google Scholar]
- Attree, Groussin, O., Jorda, L., et al. 2018, A&A, 611, A33 [NASA ADS] [CrossRef] [EDP Sciences] [Google Scholar]
- Auger, A.-T., Groussin, O., Jorda, L., et al. 2018, Icarus, 301, 173 [NASA ADS] [CrossRef] [Google Scholar]
- Belton, M. J. 2010, Icarus, 210, 881 [NASA ADS] [CrossRef] [Google Scholar]
- Bischoff, D., Gundlach, B., Neuhaus, M., & Blum, J. 2019, MNRAS, 483, 1202 [NASA ADS] [CrossRef] [Google Scholar]
- Biver, Bockelée-Morvan, D., Hofstadter, M., et al. 2019, A&A, 630, A19 [NASA ADS] [CrossRef] [EDP Sciences] [Google Scholar]
- Blum, J., Schrapler, R., Davidsson, B. J. R., & Trigo-Rodriguez, J. M. 2006, ApJ, 652, 1768 [NASA ADS] [CrossRef] [Google Scholar]
- Blum, J., Gundlach, B., Mühle, S., & Trigo-Rodriguez, J. M. 2014, Icarus, 235, 156 [NASA ADS] [CrossRef] [Google Scholar]
- Blum, J., Gundlach, B., Krause, M., et al. 2017, MNRAS, 469, S755 [CrossRef] [Google Scholar]
- Bockelée-Morvan, D., & Biver, N. 2017, Phil. Trans. Roy. Soc. A: Math. Phys. Eng. Sci., 375, 20160252 [Google Scholar]
- Bockelée-Morvan, D., Crovisier, J., Erard, S., et al. 2016, MNRAS, 462, S170 [Google Scholar]
- Cambianica, P., Fulle, M., Cremonese, G., et al. 2020, A&A, 636, A91 [EDP Sciences] [Google Scholar]
- Capaccioni, F., Coradini, A., Filacchione, G., et al. 2015, Science, 347, aaa0628 [Google Scholar]
- Chokshi, A., Tielens, A. G. G. M., & Hollenbach, D. 1993, ApJ, 407, 806 [Google Scholar]
- Chýlek, P., Ramaswamy, V., & Srivastava, V. 1983, J. Geophys. Res.: Oceans, 88, 10837 [Google Scholar]
- Ciarniello, M., Capaccioni, F., Filacchione, G., et al. 2015, A&A, 583, A31 [NASA ADS] [CrossRef] [EDP Sciences] [Google Scholar]
- Clark, R. N., & Lucey, P. G. 1984, J. Geophys. Res.: Solid Earth, 89, 6341 [Google Scholar]
- El-Maarry, M. R., Thomas, N., Gracia-Berná, A., et al. 2015, Geophys. Res. Lett., 42, 5170 [Google Scholar]
- El-Maarry, M. R., Thomas, N., Gracia-Berná, A., et al. 2016, A&A, 593, A110 [NASA ADS] [CrossRef] [EDP Sciences] [Google Scholar]
- El-Maarry, M. R., Groussin, O., Thomas, N., et al. 2017, Science, 355, 1392 [NASA ADS] [CrossRef] [Google Scholar]
- El-Maarry, M. R., Groussin, O., Keller, H. U., et al. 2019, Space Sci. Rev., 215, 36 [CrossRef] [Google Scholar]
- Farnham, T., Wellnitz, D., Hampton, D., et al. 2007, Icarus, 187, 26 [NASA ADS] [CrossRef] [Google Scholar]
- Farnham, T., Bodewits, D., Li, J.-Y., et al. 2013, Icarus, 222, 540 [NASA ADS] [CrossRef] [Google Scholar]
- Finson, M. J., & Probstein, R. F. 1968, ApJ, 154, 327 [NASA ADS] [CrossRef] [Google Scholar]
- Fulle, M., Della Corte, V., Rotundi, A., et al. 2016, MNRAS, 462, S132 [CrossRef] [Google Scholar]
- Fulle, M., Della Corte, V., Rotundi, A., et al. 2017, MNRAS, 469, S45 [Google Scholar]
- Fulle, M., Blum, J., Green, S. F., et al. 2018, MNRAS, 482, 3326 [Google Scholar]
- Goesmann, F., Rosenbauer, H., Bredehöft, J. H., et al. 2015, Science, 349, aab0689 [Google Scholar]
- Groussin, O., Jorda, L., Auger, A.-T., et al. 2015, A&A, 583, A32 [NASA ADS] [CrossRef] [EDP Sciences] [Google Scholar]
- Grün, E., Bar-Nun, A., Benkhoff, J., et al. 1989, Int. Astron. Union Colloq., 116, 277 [Google Scholar]
- Grün, E., Gebhard, J., Bar-Nun, A., et al. 1993, J. Geophys. Res.: Planets, 98, 15091 [Google Scholar]
- Gulkis, S., Allen, M., von Allmen, P., et al. 2015, Science, 347, aaa0709 [Google Scholar]
- Gundlach, B., Skorov, Y., & Blum, J. 2011, Icarus, 213, 710 [NASA ADS] [CrossRef] [Google Scholar]
- Gundlach, B., Blum, J., Keller, H. U., & Skorov, Y. V. 2015, A&A, 583, A12 [NASA ADS] [CrossRef] [EDP Sciences] [Google Scholar]
- Gundlach, B., Ratte, J., Blum, J., Oesert, J., & Gorb, S. N. 2018a, MNRAS, 479, 5272–5287 [NASA ADS] [CrossRef] [Google Scholar]
- Gundlach, B., Schmidt, K. P., Kreuzig, C., et al. 2018b, MNRAS, 479, 1273 [Google Scholar]
- Haack, D., Otto, K. A., Gundlach, B., et al. 2020, A&A, 642, A218 [EDP Sciences] [Google Scholar]
- Hässig, M., Altwegg, K., Balsiger, H., et al. 2015, Science, 347, aaa0276 [Google Scholar]
- Herique, A., Kofman, W., Beck, P., et al. 2017, MNRAS, 462, S516 [Google Scholar]
- Hornung, K., Merouane, S., Hilchenbach, M., et al. 2016, Planet. Space Sci., 133, 63 [NASA ADS] [CrossRef] [Google Scholar]
- Kappel, D., Sachse, M., Haack, D., & Otto, K. A. 2020, A&A, 641, A19 [CrossRef] [EDP Sciences] [Google Scholar]
- Kaufmann, E., & Hagermann, A. 2018, Icarus, 311, 105 [NASA ADS] [CrossRef] [Google Scholar]
- Keller, H. U., Mottola, S., Hviid, S. F., et al. 2017, MNRAS, 469, S357 [CrossRef] [Google Scholar]
- Knapmeyer, M., Fischer, H.-H., Knollenberg, J., et al. 2018, Icarus, 310, 165 [NASA ADS] [CrossRef] [Google Scholar]
- Kochan, H., Roessler, K., Ratke, L., et al. 1989, in ESA SP, 302, Physics and Mechanics of Cometary Materials, eds. J. J. Hunt, & T. D. Guyenne, 115 [Google Scholar]
- Kossacki, K., Kömle, N., Leliwa-Kopystyński, J., & Kargl, G. 1997, Icarus, 128, 127 [NASA ADS] [CrossRef] [Google Scholar]
- Kramer, T., & Noack, M. 2015, ApJ, 813, L33 [NASA ADS] [CrossRef] [Google Scholar]
- Kretke, K., & Levison, H. 2015, Icarus, 262, 9 [Google Scholar]
- Kührt, E. 1984, Icarus, 60, 512 [NASA ADS] [CrossRef] [Google Scholar]
- Kührt, E., & Keller, H. U. 1994, Icarus, 109, 121 [NASA ADS] [CrossRef] [Google Scholar]
- Kuroiwa, D. 1961, Tellus, 13, 252 [CrossRef] [Google Scholar]
- Lai, I. L., Ip, W. H., Lee, J. C., et al. 2016, in AGU Fall Meeting Abstracts, P43A-2087 [Google Scholar]
- Lai, I.-L., Ip, W.-H., Su, C.-C., et al. 2017, MNRAS, 462, S533 [Google Scholar]
- Lämmerzahl, P., Gebhard, J., Grün, E., & Klees, G. 1995, Planet. Space Sci., 43, 363 [NASA ADS] [CrossRef] [Google Scholar]
- Langevin, Y., Hilchenbach, M., Vincendon, M., et al. 2017, MNRAS, 469, S535 [CrossRef] [Google Scholar]
- Läuter, M., Kramer, T., Rubin, M., & Altwegg, K. 2018, MNRAS, 483, 852 [NASA ADS] [Google Scholar]
- Lorek, Gundlach, B., Lacerda, P., & Blum, J. 2016, A&A, 587, A128 [NASA ADS] [CrossRef] [EDP Sciences] [Google Scholar]
- Lorek, S., Lacerda, P., & Blum, J. 2018, A&A, 611, A18 [NASA ADS] [CrossRef] [EDP Sciences] [Google Scholar]
- Mottola, S., Arnold, G., Grothues, H.-G., et al. 2015, Science, 349, aab0232 [CrossRef] [Google Scholar]
- Musiolik, G., & Wurm, G. 2019, ApJ, 873, 58 [Google Scholar]
- Oehler, A., & Neukum, G. 1991, Geophys. Res. Lett., 18, 253 [Google Scholar]
- Oklay, N., Vincent, J.-B., Fornasier, S., et al. 2016, A&A, 586, A80 [NASA ADS] [CrossRef] [EDP Sciences] [Google Scholar]
- O’Rourke, L., Heinisch, P., Blum, J., et al. 2020, Nature, 586, 697 [CrossRef] [Google Scholar]
- Ott, T., Drolshagen, E., Koschny, D., et al. 2017, MNRAS, 469, S276 [CrossRef] [Google Scholar]
- Otto, K. A., Matz, K.-D., Schröder, S. E., et al. 2020, MNRAS, 500, 3178 [Google Scholar]
- Pajola, Vincent, Jean-Baptiste, Güttler, Carsten, et al. 2015, A&A, 583, A37 [NASA ADS] [CrossRef] [EDP Sciences] [Google Scholar]
- Pajola, M., Lucchetti, A., Fulle, M., et al. 2016a, MNRAS, 469, S636 [Google Scholar]
- Pajola, M., Oklay, N., Forgia, F. L., et al. 2016b, A&A, 592, A69 [NASA ADS] [CrossRef] [EDP Sciences] [Google Scholar]
- Panale, F. P., & Salvail, J. R. 1984, Icarus, 60, 476 [NASA ADS] [CrossRef] [Google Scholar]
- Pätzold, M., Andert, T. P., Hahn, M., et al. 2018, MNRAS, 483, 2337 [Google Scholar]
- Poch, O., Pommerol, A., Jost, B., et al. 2016a, Icarus, 266, 288 [NASA ADS] [CrossRef] [Google Scholar]
- Poch, O., Pommerol, A., Jost, B., et al. 2016b, Icarus, 267, 154 [NASA ADS] [CrossRef] [Google Scholar]
- Poulet, F., Lucchetti, A., Bibring, J.-P., et al. 2016, MNRAS, 462, S23 [CrossRef] [Google Scholar]
- Pommerol, A., Jost, B., Poch, O. et al. 2015, Planet. Space Sci., 109, 106 [NASA ADS] [CrossRef] [Google Scholar]
- Raponi, A., Ciarniello, M., Capaccioni, F., et al. 2020, Nat. Astron., 5, 500 [Google Scholar]
- Rotundi, A., Sierks, H., Della Corte, V., et al. 2015, Science, 347, aaa3905 [Google Scholar]
- Sandford, S. A., Aléon, J., Alexander, C. M. D., et al. 2006, Science, 314, 1720 [NASA ADS] [CrossRef] [PubMed] [Google Scholar]
- Scheeres, D., Hartzell, C., Sánchez, P., & Swift, M. 2010, Icarus, 210, 968 [NASA ADS] [CrossRef] [Google Scholar]
- Schröder, S., Mottola, S., Arnold, G., et al. 2017, Icarus, 285, 263 [NASA ADS] [CrossRef] [Google Scholar]
- Sierks, H., Barbieri, C., Lamy, P. L., et al. 2015, Science, 347, aaa1044 [Google Scholar]
- Skorov, Y., & Blum, J. 2012, Icarus, 221, 1 [NASA ADS] [CrossRef] [Google Scholar]
- Sánchez, P., & Scheeres, D. J. 2014, Meteor. Planet. Sci., 49, 788 [Google Scholar]
- Snodgrass, C., Tubiana, C., Bramich, D. M., et al. 2013, A&A, 557, A33 [NASA ADS] [CrossRef] [EDP Sciences] [Google Scholar]
- Spohn, T., Knollenberg, J., Ball, A. J., et al. 2015, Science, 349, aab0464 [NASA ADS] [CrossRef] [Google Scholar]
- Steckloff, J. K., Graves, K., Hirabayashi, M., Melosh, H. J., & Richardson, J. E. 2016, Icarus, 272, 60 [CrossRef] [Google Scholar]
- Sunshine, J. M., A. Hearn, M. F., Groussin, O., et al. 2006, Science, 311, 1453 [NASA ADS] [CrossRef] [Google Scholar]
- Thomas, P., A’Hearn, M., Belton, M., et al. 2013, Icarus, 222, 453, stardust/EPOXI [NASA ADS] [CrossRef] [Google Scholar]
- Thomas, N., Davidsson, B., El-Maarry, M. R., et al. 2015a, A&A, 583, A17 [NASA ADS] [CrossRef] [EDP Sciences] [Google Scholar]
- Thomas, N., Sierks, H., Barbieri, C., et al. 2015b, Science, 347, aaa0440 [Google Scholar]
- Tubiana, Snodgrass, C., Bertini, I., et al. 2015, A&A, 573, A62 [NASA ADS] [CrossRef] [EDP Sciences] [Google Scholar]
- Vincent, J.-B., Bodewits, D., Besse, S., et al. 2015a, Nature, 523, 63 [NASA ADS] [CrossRef] [Google Scholar]
- Vincent, J.-B., Oklay, N., Marchi, S., Höfner, S., & Sierks, H. 2015b, Planet. Space Sci., 107, 53 [NASA ADS] [CrossRef] [Google Scholar]
- Vincent, J.-B., A’Hearn, M. F., Lin, Z.-Y., et al. 2016, MNRAS, 462, S184 [CrossRef] [Google Scholar]
- Zsom, Ormel, C. W., Güttler, C., Blum, J., & Dullemond, C. P. 2010, A&A, 513, A57 [NASA ADS] [CrossRef] [EDP Sciences] [Google Scholar]
All Tables
Characteristics and chemical composition of components used to simulate cometary materials.
All Figures
|
Fig. 1 Electron-microscopy images and size distribution of the particles used in our experiments. The images of spherical fly ash in panel A and water ice particles in panel B are at the same scale (modified from Haack et al. 2020). Panel C presents thecomparable cumulative size distributions of fly ash (red dots) and water ice (blue diamonds). |
| In the text | |
|
Fig. 2 Filling fractions and tensile strengths of different water ice-fly ash mixtures. Pure ice corresponds to 0 vol% on the left, and therespective pure fly ash to 100 vol% on the right. The error of the water ice-fly ash mixing ratio originates from the uncertainty as to the ice mass determination. |
| In the text | |
|
Fig. 3 Preparation of the samples. Panel A: metal cylinder (left) and sample holder (right) that were used to prepare the samples. The green cable with the connector belongs to one of the thermocouple sensors, which was used to monitor the sample temperature during the experiment. Panel B: the metal cylinder was plugged onto the sample holder and filled with a suspension of liquid nitrogen, water ice, and dust particles. To ensure that the setup was constantly cooled while the liquid nitrogen evaporated from the sample mixture, the outer volume of the sample holder was also filled with liquid nitrogen. |
| In the text | |
|
Fig. 4 Setupof the sublimation experiments. Panel A: cylindrical vacuum sublimation chamber with two observation windows. One is located on the top and one on the lateral side of the chamber. In the configuration shown, the light enters the chamber from above. Panel B: view through the lateral observation window into the inside of the vacuum sublimation chamber. The sample holder is firmly attached to the cuboid cooling shield. The object visible inside the cooling shield is the sample insolated from above. The green cables in the chamber belong to the different temperature sensors that monitor the temperature of the sample and the experimental setup. A camera is directed at the sample from outside. |
| In the text | |
|
Fig. 5 Two examples of the monitored pressure and temperatures in the chamber for two samples with 25 vol% water ice, each. The recordings were made every second from the beginning of the experiment to its end. Panel A: the insolation with ~ 3 solar constants was vertical from above. When the sublimation activity of the sample stopped after about 3 h, the pressure and temperatures remained stable until the end of the experiment. Panel B: the insolation was horizontal from the side. The temperatures of the sample and setup remained approximately stable. The pressure curve shows two short-term increases after 3 and 5.5 h, which can be attributed to two collapse events on the sample. The sample temperature increased at ~ 0.5 h after the remainder of liquid nitrogen vaporized from the sample. |
| In the text | |
|
Fig. 6 Five vertically insolated samples with different dust-to-water ice ratios at an insolation rate of ~ 3 solar constants. The image series show how the sublimation activity reduces with a decreasing water ice content (online movies). At a 66 vol% water ice content, several ejected particles are visible as elongated bright dashes (in the panels with a timestamp of 0.5 h and 6.0 h) and the whole sample has disappeared after about 6 h of continuous sublimation. The series of pictures with a 33 vol% and 50 vol% water ice content show the erosion of lateral surfaces, the formation of a talus, and the granular structure of the sample material. The first two images of the series with 33 vol% water ice appear brighter because the filter in front of the camera, which reduces the brightness, was not installed and was added during the experiment. The shape of the samples with a 25 vol% and 20 vol% water ice content changed rather in single events (ejections) and did not experience any further visible changes after about 3 h (see Fig. 5A). |
| In the text | |
|
Fig. 7 Comparison between laboratory results and observations on 67P. Panels A–C show details of different vertically illuminated samples from Fig. 6 during the phase of active sublimation in the laboratory. Panels D–F show images of the in situ surface of comet 67P to compare them with the corresponding lab results. Panel A: exotic morphology of the sample with a 66 vol% water ice content. The arrows indicate extreme overhangs, which did not collapse immediately. Panel B: shown is an enlarged section of the sample with a 50 vol% water ice content. The dotted line separates the sample wall (upper area) from the talus of loose debris (lower area). The granular structure of the sample material is clearly visible. The micrometer-sized individual particles (see Fig. 1) form aggregates of up to 1.5 mm in size and frequently remain intact when they detach from the sample and accumulate on the talus. This image represents the granular structure of all investigated samples. Panel C: the sample with a 20 vol% water ice content in the early phase of the experiment. Several fragments up to a millimeter in size were detached from the sample’s surface and ejected in single outburst events. Panel D: a detailed image of the surface of 67P taken by the Philae lander. It shows the actual surface of 67P without extreme overhangs as seen in panel A (ROLIS image derived from Schröder et al. (2017)). Panel E: a cliff on the comet with a talus of debris material that is reminiscent of laboratory results in panel B. Panel F: an outburst plume at the surface of 67P. Agarwal et al. (2016) describe meter-sized boulders that were ejected during these outbursts. Image credits: ESA/Rosetta/MPS for OSIRIS Team MPS/UPD/LAM/IAA/SSO/INTA/UPM/DASP/IDA. |
| In the text | |
|
Fig. 8 Evolution of the five different ice-dust mixtures with horizontal insolation. The occurrence of collapse events with different sample compositions is noticeable (online movies). Samples with a 33 vol% and 50 vol% water ice content show a continuous alteration of their shape until the end of the sublimation activity and formation of talus at their base. At a 25 vol% and 20 vol% water ice content, single events occurred in the form of cliff collapses exposing fresh material on the surface (see Fig. 5B). After 5.5 h and 3 h, respectively, no further alterations on the surface were visible. The bright areas in the upper right corner of the images with 20 vol% water ice are reflections of a light source in the laboratory on the observation window of the sublimation chamber. |
| In the text | |
|
Fig. 9 Schematic and qualitative overview of parameters affecting the alteration of the sample’s surfaces in the experiment. Vertical insolation and high ice content result in a more continuous alteration and increase its duration. Horizontal insolation and high dust content result more often in spontaneous outburst and collapse events and decrease the overall duration of active surface alteration. |
| In the text | |
Current usage metrics show cumulative count of Article Views (full-text article views including HTML views, PDF and ePub downloads, according to the available data) and Abstracts Views on Vision4Press platform.
Data correspond to usage on the plateform after 2015. The current usage metrics is available 48-96 hours after online publication and is updated daily on week days.
Initial download of the metrics may take a while.