Fig. 1
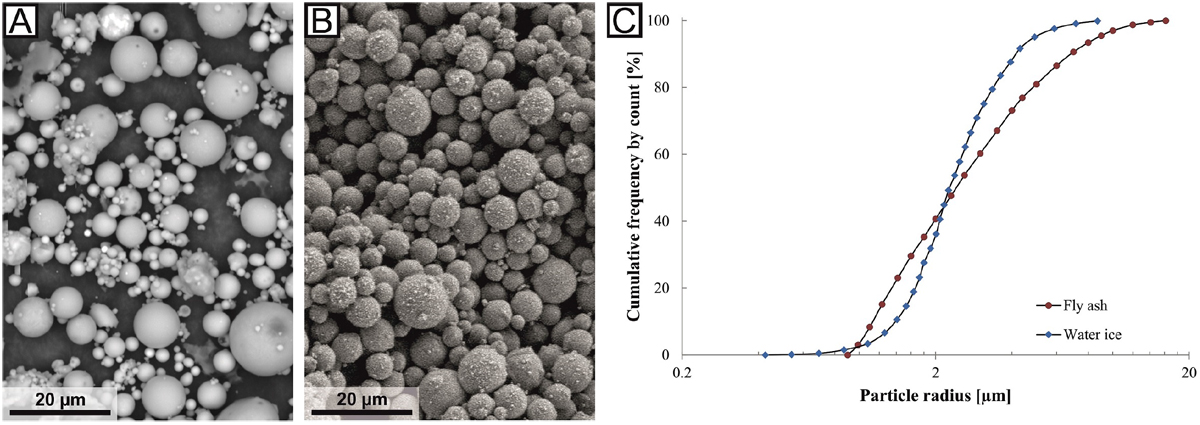
Electron-microscopy images and size distribution of the particles used in our experiments. The images of spherical fly ash in panel A and water ice particles in panel B are at the same scale (modified from Haack et al. 2020). Panel C presents thecomparable cumulative size distributions of fly ash (red dots) and water ice (blue diamonds).
Current usage metrics show cumulative count of Article Views (full-text article views including HTML views, PDF and ePub downloads, according to the available data) and Abstracts Views on Vision4Press platform.
Data correspond to usage on the plateform after 2015. The current usage metrics is available 48-96 hours after online publication and is updated daily on week days.
Initial download of the metrics may take a while.