Fig. 7
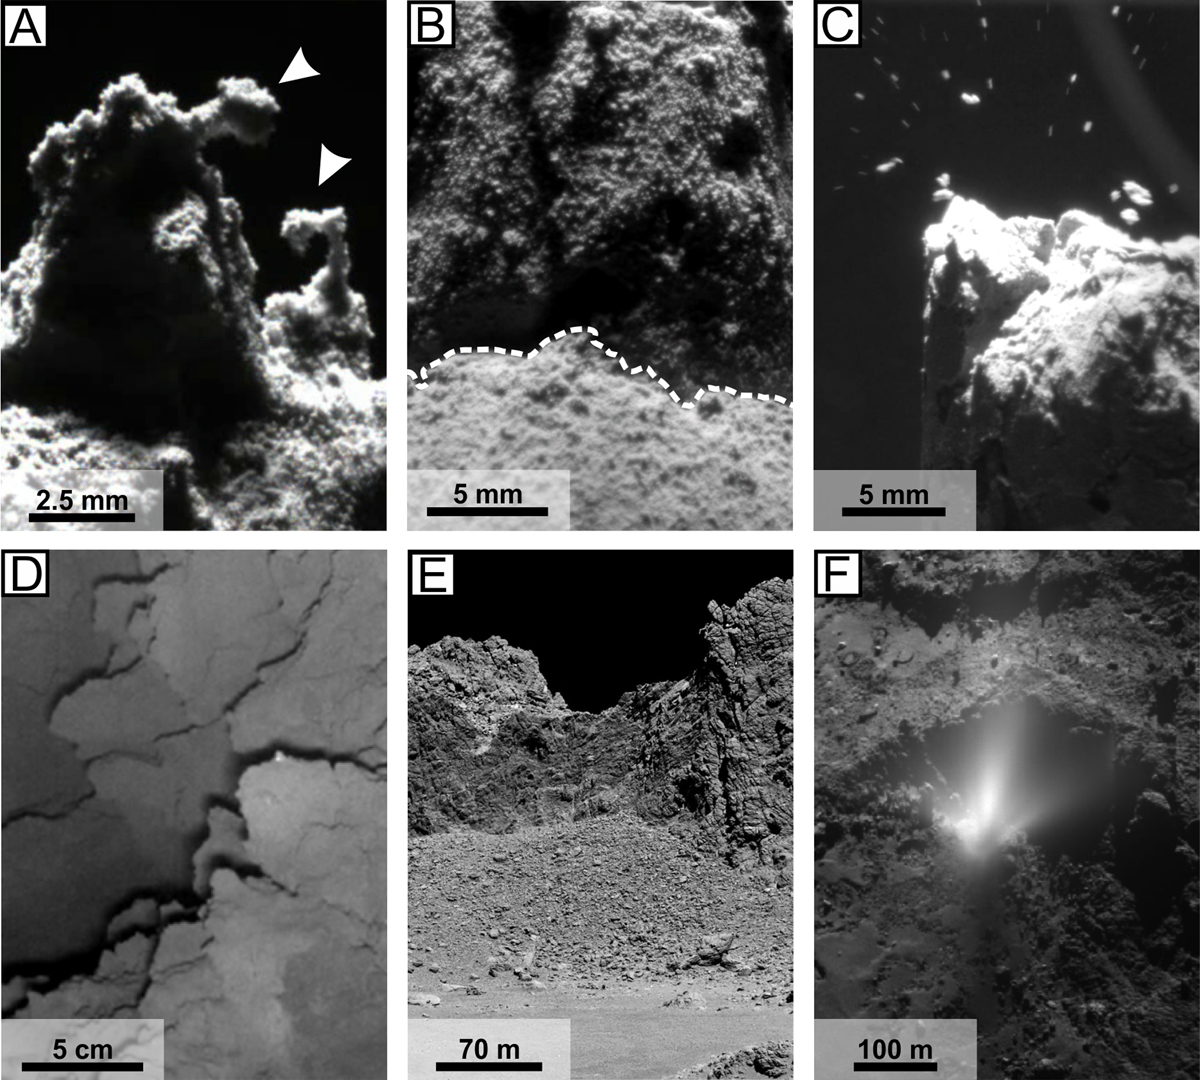
Comparison between laboratory results and observations on 67P. Panels A–C show details of different vertically illuminated samples from Fig. 6 during the phase of active sublimation in the laboratory. Panels D–F show images of the in situ surface of comet 67P to compare them with the corresponding lab results. Panel A: exotic morphology of the sample with a 66 vol% water ice content. The arrows indicate extreme overhangs, which did not collapse immediately. Panel B: shown is an enlarged section of the sample with a 50 vol% water ice content. The dotted line separates the sample wall (upper area) from the talus of loose debris (lower area). The granular structure of the sample material is clearly visible. The micrometer-sized individual particles (see Fig. 1) form aggregates of up to 1.5 mm in size and frequently remain intact when they detach from the sample and accumulate on the talus. This image represents the granular structure of all investigated samples. Panel C: the sample with a 20 vol% water ice content in the early phase of the experiment. Several fragments up to a millimeter in size were detached from the sample’s surface and ejected in single outburst events. Panel D: a detailed image of the surface of 67P taken by the Philae lander. It shows the actual surface of 67P without extreme overhangs as seen in panel A (ROLIS image derived from Schröder et al. (2017)). Panel E: a cliff on the comet with a talus of debris material that is reminiscent of laboratory results in panel B. Panel F: an outburst plume at the surface of 67P. Agarwal et al. (2016) describe meter-sized boulders that were ejected during these outbursts. Image credits: ESA/Rosetta/MPS for OSIRIS Team MPS/UPD/LAM/IAA/SSO/INTA/UPM/DASP/IDA.
Current usage metrics show cumulative count of Article Views (full-text article views including HTML views, PDF and ePub downloads, according to the available data) and Abstracts Views on Vision4Press platform.
Data correspond to usage on the plateform after 2015. The current usage metrics is available 48-96 hours after online publication and is updated daily on week days.
Initial download of the metrics may take a while.