| Issue |
A&A
Volume 649, May 2021
|
|
|---|---|---|
| Article Number | L13 | |
| Number of page(s) | 8 | |
| Section | Letters to the Editor | |
| DOI | https://doi.org/10.1051/0004-6361/202140404 | |
| Published online | 13 May 2021 | |
Letter to the Editor
Variation of the core lifetime and fragmentation scale in molecular clouds as an indication of ambipolar diffusion
1
Department of Applied Mathematics, University of Western Ontario, London, Ontario N6A 5B7, Canada
e-mail: This email address is being protected from spambots. You need JavaScript enabled to view it.
2
Department of Physics and Astronomy, University of Western Ontario, London, Ontario N6A 3K7, Canada
e-mail: This email address is being protected from spambots. You need JavaScript enabled to view it.
3
Laboratoire d’Astrophysique (AIM), CEA/DRF, CNRS, Université Paris-Saclay, Université Paris Diderot, Sorbonne Paris Cité, 91191 Gif-sur-Yvette, France
e-mail: This email address is being protected from spambots. You need JavaScript enabled to view it.
Received:
22
January
2021
Accepted:
20
April
2021
Abstract
Ambipolar diffusion likely plays a pivotal role in the formation and evolution of dense cores in weakly ionized molecular clouds. Linear analyses show that the evolutionary times and fragmentation scales are significantly greater than the hydrodynamic (Jeans) values even for clouds with mildly supercritical mass-to-flux ratios. We use values of fragmentation scales and growth times that correspond to typical ionization fractions within a molecular cloud, and apply these in the context of the observed estimated lifetime of prestellar cores and the observed number of such embedded cores forming in a parent clump. By varying a single parameter – the mass-to-flux ratio – over the range of observationally measured densities, we fit the range of estimated prestellar core lifetimes (∼0.1 to a few Myr) identified with Herschel as well as the number of embedded cores formed in a parent clump measured in Perseus with the Submillimeter Array. Our model suggests that the prestellar cores are formed with a transcritical mass-to-flux ratio and higher densities correspond to somewhat higher mass-to-flux ratios, but the normalized mass-to-flux ratio μ remains in the range 1 ≲ μ ≲ 2. Our best-fit model exhibits B ∝ n0.43 for prestellar cores because of the partial flux-freezing caused by ambipolar diffusion.
Key words: magnetic fields / stars: formation / diffusion / magnetohydrodynamics (MHD) / ISM: clouds
© ESO 2021
1. Introduction
There are still many gaps in our understanding of the condensation of dense structures out of the diffuse interstellar medium (ISM). There are reasons to think that the influence of the magnetic field is preponderant. In recent years, remarkable observational data have been obtained by Planck Collaboration Int. XXXV (2016) that allow a quantitative analysis of the relative orientation of the magnetic field within a set of nearby (d < 450 pc) molecular clouds. These observations have helped to establish the significance of magnetic fields in the formation of dense structures on physical scales ranging from approximately 1 to 10 pc. They show a clear correlation in the direction of elongation of high-density regions (number column density NH ≳ 1022 cm−2), which appears to be perpendicular to the ambient magnetic field direction.
Molecular clouds are known to contain hierarchical nested density structures with, for example, clumps, filaments, and cores (see André et al. 2014; Dobbs et al. 2014; Heyer & Dame 2015). Pokhrel et al. (2018) studied hierarchical structure over five different scales (ranging from ≳10 pc to 10 AU) in the Perseus molecular cloud using new observations from the Herschel, the James Clerk Maxwell Telescope (JCMT), the Submillimeter Array (SMA), the Very Large Array (VLA). They compared the number of fragments with the number of Jeans masses at each scale to calculate the Jeans efficiency, which is the ratio of observed to expected number of fragments. Könyves et al. (2015) used the results of the Herschel Gould Belt survey (HGBS- André et al. 2010) in the Aquila molecular cloud complex, and compared the numbers of prestellar cores in various density bins to the number of young stellar objects (YSOs). They estimated that the lifetime of prestellar cores is ∼1 Myr, which is about four times longer than the core free-fall time, and that the lifetime decreases as the average core density increases. While current observations cannot determine whether ambipolar diffusion (neutral-ion slip) is occurring during the initiation of gravitational collapse, nonideal magnetohydrodynamic (MHD) simulations suggest it plays an important role in establishing mildly supercritical mass-to-flux ratios in prestellar cores, whether starting from small-amplitude perturbations (see Kudoh et al. 2007; Basu et al. 2009a) or from large-scale turbulent or converging flows (see Nakamura & Li 2005; Basu et al. 2009b; Chen & Ostriker 2014). Furthermore, in mildly supercritical regions, the hybrid modes driven by gravity and neutral-ion slip result in preferred length scales and growth times that can significantly exceed the Jeans scale and free-fall time, respectively (see Basu & Ciolek 2004; Ciolek & Basu 2006; Bailey & Basu 2012).
In this Letter, we probe the variation of lifetime and fragmentation scales of dense structures in molecular clouds as a consequence of ambipolar diffusion. We apply the results of a linear analysis of ambipolar-diffusion-driven fragmentation in planar, isothermal, weakly ionized, self-gravitating sheetlike magnetic clouds. The calculated shortest growth timescale and preferred fragmentation mass for collapse are used to explain the observationally estimated lifetime of prestellar cores and the number of enclosed cores in a parent clump. In Sect. 2 we describe the analytic model, in Sect. 3 we present a comparison with the observational findings, and finally, in Sect. 4 we summarize and draw conclusions from our results.
2. Analytic model
We model interstellar molecular clouds as self-gravitating, partially ionized, isothermal, magnetic, planar, thin sheets with infinite extent in the x- and y-directions and a local vertical half-thickness Z(x, y, t). Although sheets are an idealized geometry, a structured background state like a sheet or filament does capture the essential feature of a preferred scale of instability that is related to the local density scale length; this would not appear if assuming a uniform background. We note that the critical length scale and timescale can differ typically by a factor of approximately two as compared to using a spherical (uniform) geometry. Our static initial state also does not include the effect of any large-scale motion that modifies the evolutionary timescale. The nonaxisymmetric equations and formulations of the model have been described in detail in several papers (Ciolek & Basu 2006; Bailey & Basu 2012). The evolution equations include the nonideal MHD effect of ambipolar diffusion, the process by which neutrals are partially coupled to magnetic field through collisions with ions. This effect is quantified by the neutral-ion collision (momentum-exchange) timescale (e.g., Basu & Mouschovias 1994):
 (1)
(1)
where ⟨σw⟩iH2 is the average collision rate between ions of mass mi (singly ionized Na, Mg, and HCO, adopted to have a mass of 25 amu) and neutrals of mass mn(= 2.33 amu). We adopt a neutral–ion collision rate between H2 and HCO+ of 1.69 × 10⁻⁹ cm3 s−1 (McDaniel & Mason 1973). For the ion number density ni, there is an assumed constant power-law approximation of the form  (Ciolek & Basu 2006; Ciolek & Mouschovias 1998), where nn, 0 is the initial uniform number density of neutrals. The typical observed ionization fraction in molecular clouds (primarily due to cosmic ray ionization) (Elmegreen 1979; Tielens 2005) is
 (2)
(2)
Such low ionization means that ambipolar diffusion is unavoidable in molecular clouds, but there is still enough coupling with the charged species for the neutrals to be affected by the magnetic field. This is because of the high polarizability of the neutrals, particularly H2 molecules (Osterbrock 1961). The threshold for whether a region of a molecular cloud is magnetically dominated or gravitationally dominated is given by the normalized mass-to-flux ratio,
 (3)
(3)
where σn, 0 is the initial uniform column density of the sheet, Bref is the magnetic field strength of the background reference state, G is the universal gravitational constant, and (2πG1/2)−1 is the critical mass-to-flux ratio for gravitational collapse (Nakano & Nakamura 1978). Regions with μ0 < 1 are defined as subcritical, regions with μ0 > 1 are defined as supercritical, and regions with μ0 ≈ 1 are defined as transcritical. For small amplitude perturbations, the governing equations can be combined to yield the following dispersion relation:
![Mathematical equation: $$ \begin{aligned} \left(\omega + i \theta \right) \big [\omega ^2 - C^2_{\mathrm{eff},0} k^2 +&2\pi G \sigma _{n,0} k \big ] = \nonumber \\&\omega \left[2\pi G \sigma _{n,0} k \mu _0 ^{-2} + k^2 V^2 _{A,0} \right] , \end{aligned} $$](/articles/aa/full_html/2021/05/aa40404-21/aa40404-21-eq5.gif) (4)
(4)
where
 (5)
(5)
ω is an angular frequency, and  , where kx, ky, kz (or k) are the wavenumbers in the x-, y-, and z- directions, respectively. To obtain the dispersion relation as shown in Eq. (4), the linearized perturbed MHD equations are used (see Appendix A). Here, Ceff, 0 and VA, 0 are the local effective sound speed and the Alfvén speed, respectively. The term Ceff, 0 includes the effects of a restoring force due to an external pressure Pext. The dimensionless external pressure
  (
( ) and temperature (T) are kept fixed at 0.1 and 10 K, respectively.
Figure 1 presents the normalized shortest growth timescale, τg, m/tff, and normalized preferred fragmentation mass, Mg, m/MT, m, corresponding to this minimum timescale as a function of μ0 for the case of normalized neutral–ion collision time  which itself corresponds to Eq. (2). Here, tff is the dynamical, i.e., free-fall time ( = Z0/cs), MT, m is the preferred thermal mass based on our model, and
  , where M0 is effectively the Jeans mass. See Appendix A for definitions and typical values of the units of time (t0), length (L0), and mass (M0), and other parameters. For all objects shown in Table B.2, we calculate Mg, m in units of Mc = πσn, 0(L0/2)2 = πM0/4, as the perturbation is taken to be circular with radius L0/2. As the mass-to-flux ratio goes to the subcritical regime where ambipolar diffusion drives the evolution, the curve of shortest growth timescale approaches a plateau. It is noteworthy that the peak preferred fragmentation mass for collapse exceeds the Jeans mass by a factor of up to ten. Furthermore, for
  the timescale for collapse of a subcritical region is around 10 − 12 times longer than that of a supercritical region; this is the origin of the often-quoted result that the ambipolar diffusion time is approximately ten times the free-fall time (Mouschovias 1991; Ciolek & Basu 2006; Bailey & Basu 2012; Das & Basu 2021). Hereafter, for a better representation, we use nn, σn, and μ instead of nn, 0, σn, 0, μ0, respectively. In this study, we are interested in the regime where the normalized mass-to-flux ratio μ remains in the range 1 ≲ μ ≲ 2. See Kunz & Mouschovias (2009) for an application of the linear theory in the subcritical regime to model core masses.
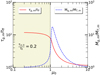 |
Fig. 1. Growth timescale τg, m (in the units of dynamical or free-fall time tff) and the preferred fragmentation mass Mg, m (in the units of preferred thermal fragmentation mass MT, m) of the most unstable mode as a function of the normalized mass-to-flux ratio (μ0). The model utilizes the standard ionization fraction corresponding to a normalized neutral–ion collision time |
3. Observational correspondence to prestellar cores
In this section we discuss the relevance of our theoretical results to observational findings, focusing on the mildly supercritical regime.
3.1. Lifetime of prestellar cores
The technique for finding the timescale of the core-formation process was introduced by Beichman et al. (1986) in the context of IRAS sources. These authors studied the embedded YSOs within the core sample of Myers & Benson (1983) and Myers et al. (1983), and found that 35 cores had IRAS sources meeting the color-selection criteria of embedded YSOs and 43 had no embedded IRAS sources. Beichman et al. (1986) calculated the percentage of cores with embedded sources to estimate the lifetime of a core without an embedded YSO by comparing it with the lifetime of the embedded YSO phase. Using an estimated lifetime of cores with embedded class II sources of 1 − 2 Myr (as discussed in Ward-Thompson et al. 1994; Evans et al. 2009), and assuming that the prestellar cores go on to form protostars, the prestellar core lifetime is estimated to be
![Mathematical equation: $$ \begin{aligned} \tau = \frac{\mathrm{\# \ of \ cores \ without \ embedded \ sources}}{\mathrm{\# \ of \ cores \ with \ embedded \ sources}} \times {[1{-}2]\,\mathrm{Myr}}. \end{aligned} $$](/articles/aa/full_html/2021/05/aa40404-21/aa40404-21-eq14.gif) (6)
(6)
This formula was used by Jessop & Ward-Thompson (2000) on a catalog of molecular cloud cores from the all-sky IRAS Sky Survey Atlas (ISSA), and their Fig. 6 (often called a “JWT” plot) shows the estimated lifetime versus mean density. In a similar way, Könyves et al. (2015) estimated the lifetime of prestellar cores (see their Fig. 9) by comparing the number of prestellar cores found with Herschel to the number of Class II YSOs detected by Spitzer in the Aquila cloud. This study had the advantage of considering a homogeneous sample of cores from a single cloud (Aquila), measured using a single telescope, tracer (dust), and analysis technique that separated prestellar (gravitationally bound) cores from starless (unbound) cores. Some of the underlying assumptions in these studies are: (1) that prestellar cores will evolve into YSOs in the future; and (2) that star formation proceeds at a roughly constant rate, at least when averaged over an entire cloud.
Figure 2 presents the core lifetime (values in green filled squares) estimated from our model as the instability growth time at a particular density nn, when adopting a specific model for Bref as a function of nn (see Fig. 4 and Eq. (7) below). The corresponding estimated numbers based on the observations of candidate prestellar cores identified with Herschel (Könyves et al. 2015) and the literature data (Ward-Thompson et al. 2007) are also shown. We achieve the good correspondence by varying only one relationship, namely that between the normalized mass-to-flux-ratio μ and the number density nn, with μ ranging from about 1.1 to 1.5 for nn in the range of 104 − 106 cm−3. To calculate μ we evaluate σn using Eq. (A.5). These values of μ are in the range of mildly supercritical values generally obtained from Zeeman detections and use of the Davis-Chandrasekhar-Fermi (DCF) method (Crutcher 2012; Pattle & Fissel 2019). The ionization level is set by the value  corresponding to the standard value set by Eq. (2). Our use of the instability growth time as a proxy for the evolutionary time is similar to the commonly used comparison of the free-fall time at a particular density with the evolutionary time of a core at that density. Figure 2 shows that the typical lifetime of prestellar cores decreases from ∼1.37 Myr for cores with a number density of ∼104 cm−3 to ∼0.35 Myr at ∼105 cm−3, and to ∼0.05 Myr at ∼106 cm−3 (see Table B.1). The timescale for collapse of a core with a number density of ∼104 cm−3 is around 10 − 50 times longer than that of a highly dense core of ∼105 − 106 cm−3. The highest density cores are significantly supercritical and evolve essentially on a free-fall timescale (tff = Z0/cs) as shown in Fig. 1. The lower black dashed line presents the dynamical timescale, or free-fall time, as a reference line.
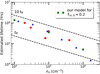 |
Fig. 2. Estimated lifetime as a function of number density (nn). The green filled squares are obtained from our model for a normalized neutral–ion collision time |

3.2. Number of enclosed cores
Sadavoy et al. (2010) used point-source photometry to explore the dense cores in the Perseus star-forming complex as found in surveys with SCUBA (85 μm) and Spitzer Space Telescope (3.6 − 70 μm). Mercimek et al. (2017) characterized the distribution of these cores inside the clumps. Pokhrel et al. (2018) analyzed the submillimeter starless or protostellar cores in the Herschel column density maps of Mercimek et al. (2017) and used the estimated mass and areas (see Table B.2) to determine the average density of each clump for AV > 7 mag. These authors used the dust temperatures from Sadavoy et al. (2014) to estimate the thermal support. To calculate the Jeans number (NJ, CLUMP ≡ M/MJ, th, i.e., the number of contained thermal Jeans masses MJ, th) of the clumps, Pokhrel et al. (2018) used the line-of-sight averaged temperatures and mass derived in Sadavoy et al. (2014).
We fit the observations of the number of enclosed cores (NumCORE) in each clump as a function of the corresponding Jeans number of the clumps, as seen in Fig. 3. We calculate NumCORE in the context of our model by dividing the total clump mass M by the preferred fragmentation mass Mg, m, adopting  . We note that Mg, m significantly exceeds MJ, th for mildly supercritical objects. The Jeans number NJ, CLUMP is the expected number of cores in the context of thermally regulated fragmentation. See Table B.2 for detailed specifications of all the clumps. The clumps are arranged in an increasing order of NumCORE (i.e., number of cores). Figure 3 shows that the number of cores (blue filled circles) increases with the Jeans number of the clumps, as shown in Fig. 6 of Pokhrel et al. (2018). The filled green crosses represent our model values. The black dashed line shows the efficiency of unity (ϵth = 1, i.e., NumCORE = NJ, CLUMP) corresponding to purely thermally regulated fragmentation.
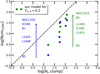 |
Fig. 3. Number of enclosed cores (log[NumCORE]) as a function of Jeans number (log[NJ, CLUMP]) of clumps. The blue filled circles represent the observed number of enclosed cores as found by Pokhrel et al. (2018). The green filled crosses are obtained from our model for a normalized neutral–ion collision time |

The observations show fewer cores than that predicted with only thermal pressure. This hints at a larger threshold for fragmentation mass that includes effects beyond that set by thermal pressure alone. In our model, Mg, m serves such a purpose as a magnetic-field-dependent instability threshold in contrast to a Jeans mass.
It is worth noting that the number of fragmented cores is also dependent on the clump mass. The relatively massive clumps are able to generate more cores and NumCORE comes closer to (but stays below) the value of NJ, CLUMP. Therefore, the number density might not be the only key parameter in this context. The nonthermal motions in these massive clouds could also play a role. However, using the nonthermal dispersion in the calculation of the Jeans mass would not fit the observations for these clouds either, predicting many fewer cores than are observed (see the discussion in Pokhrel et al. 2018).
The inability of the observed nonthermal dispersion to be used as the source of an internal pressure when estimating the number of fragmented cores could possibly be attributed to the following reasons. First, the nonthermal motions may arise at least in part due to large-scale velocity gradients, in which case they cannot act as an effective pressure. Simulations in turbulent boxes that have global stability show that small-scale collapse still occurs unless the driving scale and/or power spectrum is peaked at extremely short scales (e.g., Vazquez-Semadeni et al. 1996; Klessen et al. 2000). Second, the nonthermal dispersion may be dominated by motions in the lowest densities that are traced, while a dense layer that actually undergoes fragmentation may have a lower dispersion that is closer to the thermal value. The latter explanation is supported by simulations (Kudoh & Basu 2003, 2006; Folini et al. 2004) that show that the velocity dispersion peaks in the low-density regions of a stratified molecular cloud. In observations as well, the velocity dispersion peaks in low-density regions and starless dense cores correspond to minima in velocity dispersion maps (see, e.g., Fig. 13 of Friesen et al. 2017).
3.3. Estimation of magnetic field
For gravitationally contracting fragments (particularly cores) in magnetic interstellar clouds, the relation between magnetic-field strength Bref and gas number density nn is of considerable interest. In Fig. 4, we present log(Bref/μG) (which is obtained from our model) as a function of log(nn/cm−3) for the two different density regimes shown in Figs. 2 and 3 based on our model for  . We use the least-squares method to find a best fit to the data:
 (7)
(7)
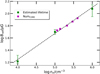 |
Fig. 4. Magnetic field log(Bref/μG) vs. number density |


where κ = 0.427 and A = 1.766, and shown by the black dashed line in Fig. 4.
Mestel (1965) argued that for a spherically and isotropically collapsing magnetic cloud, the scaling between the magnetic field strength and the density is  . This argument is true for a quasi-spherical collapse where both the mass M and the magnetic-flux Φ are being conserved, and the magnetic field energy is insignificant compared to the gravitational energy. Later, Mouschovias (1976a,b) argued that the plasma β (
 ) remains constant during self-contraction of a cloud with a dynamically important magnetic field, therefore
  , although for individual points within the cloud the exponent was in the range 1/3 − 1/2. These theories assume an evolutionary sequence and that the mass-to-flux ratio and internal thermal (or turbulent) velocity dispersion stays fixed. We should keep in mind that the full virial relation is
 (8)
(8)
where σ is the velocity dispersion. With the inclusion of ambipolar diffusion and a systematically increasing value of μ as nn increases, the slope in the Bref − nn relation is expected to be less than in the flux-freezing models. On the other hand, a systematic dependence of σ on nn can also have an effect. Crutcher et al. (2010) fitted a slope of ≈2/3 to Zeeman magnetic field data for an ensemble of dense molecular gas clouds. The B − n relation shown in Fig. 4 is for prestellar cores while the B − n relation shown by Crutcher et al. (2010) includes a number of massive protostellar cores or clumps. Those objects definitely do not represent an evolutionary sequence, with the higher density objects representing much more massive clouds that also have an increased velocity dispersion σ. A better fit to the ensemble of different clouds measured by the Zeeman effect is B ∝ σn1/2 (Basu 2000) and was verified by Li et al. (2015) who used the updated data in Crutcher (2012) and pointed out that the ensemble of objects in the data set also have the correlation σ ∝ n1/6, thereby leading to an apparent B ∝ n2/3. A similar result was obtained for B determined using the DCF technique (Myers & Basu 2021).
4. Conclusions
We used a semi-analytic model of ambipolar-diffusion-driven gravitational fragmentation in isothermal self-gravitating interstellar molecular clouds. The only requirements in our model are that prestellar cores are transcritical (mildly supercritical), with 1 ≲ μ ≲ 2, and an evolution toward the higher values of μ as the density increases. With this assumption we show that there is a significant and systematic variation of lifetime and fragmentation scale in molecular clouds. Such systematic variations do not exist in standard thermal-pressure-dominated (Jeans) fragmentation theory and are difficult to reproduce in turbulence-regulated models. Our best-fit model for prestellar cores suggests B ∝ n0.43 (see Fig. 4 and Eq. (7)), which attains a shallower slope than the flux-frozen case due to the effects of ambipolar diffusion. The estimated lifetime of prestellar cores and the possible number of cores within a parent clump/cloud based on the model for  agree well with that of observations presented by Könyves et al. (2015) and Pokhrel et al. (2018), respectively. For the lower end (∼104 cm−3) of the density regime, the timescale for collapse of prestellar cores is approximately six times longer than the free-fall timescale. On the other hand, for the case of higher number density (∼106 cm−3), the timescale is nearly the same as the free-fall timescale. The mass scales of fragment formation are also significantly greater than the Jeans mass in this mildly supercritical regime.
We adopted the dimensionless neutral-ion collision time  because of its correspondence to the typical ionization fraction (∼10−7) at a neutral number density (∼104 cm−3). In future studies, the role of varying
  could be explored in order to compare with measured ionization fractions in cores (see Caselli et al. 2002), and perhaps constrain the cosmic ray ionization rate (canonical value ζCR = 10−17 s−1).
Our model provides a means to indirectly infer the effect of ambipolar diffusion on mildly supercritical dense regions (prestellar cores) of molecular clouds. The importance of ambipolar diffusion in dense supercritical molecular cloud gas has not been discussed widely and is independent of its possible effects in low-density molecular cloud envelopes.
Acknowledgments
We thank the anonymous referee for comments that improved the manuscript. SB is supported by a Discovery Grant from NSERC. PhA acknowledges support from ‘Ile de France’ regional funding (DIM-ACAV+ Program) and from the French national programs of CNRS/INSU on stellar and ISM physics (PNPS and PCMI).
References
- André, P., Men’shchikov, A., Bontemps, S., et al. 2010, A&A, 518, L102 [NASA ADS] [CrossRef] [EDP Sciences] [Google Scholar]
- André, P., Di Francesco, J., Ward-Thompson, D., et al. 2014, in Protostars and Planets VI, eds. H. Beuther, R. S. Klessen, C. P. Dullemond, & T. Henning, 27 [Google Scholar]
- Bailey, N. D., & Basu, S. 2012, ApJ, 761, 67 [NASA ADS] [CrossRef] [Google Scholar]
- Basu, S. 2000, ApJ, 540, L103 [NASA ADS] [CrossRef] [Google Scholar]
- Basu, S., & Ciolek, G. E. 2004, ApJ, 607, L39 [NASA ADS] [CrossRef] [Google Scholar]
- Basu, S., & Mouschovias, T. C. 1994, ApJ, 432, 720 [NASA ADS] [CrossRef] [Google Scholar]
- Basu, S., Ciolek, G. E., & Wurster, J. 2009a, New Astron., 14, 221 [NASA ADS] [CrossRef] [Google Scholar]
- Basu, S., Ciolek, G. E., Dapp, W. B., & Wurster, J. 2009b, New Astron., 14, 483 [NASA ADS] [CrossRef] [Google Scholar]
- Beichman, C. A., Myers, P. C., Emerson, J. P., et al. 1986, ApJ, 307, 337 [NASA ADS] [CrossRef] [Google Scholar]
- Caselli, P., Walmsley, C. M., Zucconi, A., et al. 2002, ApJ, 565, 344 [Google Scholar]
- Chen, C.-Y., & Ostriker, E. C. 2014, ApJ, 785, 69 [NASA ADS] [CrossRef] [Google Scholar]
- Ciolek, G. E., & Basu, S. 2006, ApJ, 652, 442 [NASA ADS] [CrossRef] [Google Scholar]
- Ciolek, G. E., & Mouschovias, T. C. 1998, ApJ, 504, 280 [NASA ADS] [CrossRef] [Google Scholar]
- Crutcher, R. M. 2012, ARA&A, 50, 29 [NASA ADS] [CrossRef] [Google Scholar]
- Crutcher, R. M., Wandelt, B., Heiles, C., Falgarone, E., & Troland, T. H. 2010, ApJ, 725, 466 [NASA ADS] [CrossRef] [Google Scholar]
- Das, I., & Basu, S. 2021, ApJ, 910, 163 [NASA ADS] [CrossRef] [Google Scholar]
- Dobbs, C. L., Krumholz, M. R., Ballesteros-Paredes, J., et al. 2014, in Protostars and Planets VI, eds. H. Beuther, R. S. Klessen, C. P. Dullemond, T. Henning, 3 [Google Scholar]
- Elmegreen, B. G. 1979, ApJ, 232, 729 [NASA ADS] [CrossRef] [Google Scholar]
- Evans, N. J., Dunham, M. M., Jørgensen, J. K., et al. 2009, ApJS, 181, 321 [Google Scholar]
- Folini, D., Heyvaerts, J., & Walder, R. 2004, A&A, 414, 559 [NASA ADS] [CrossRef] [EDP Sciences] [Google Scholar]
- Friesen, R. K., Pineda, J. E., co-PIs, et al. 2017, ApJ, 843, 63 [NASA ADS] [CrossRef] [Google Scholar]
- Heyer, M., & Dame, T. 2015, ARA&A, 53, 583 [NASA ADS] [CrossRef] [Google Scholar]
- Jessop, N. E., & Ward-Thompson, D. 2000, MNRAS, 311, 63 [NASA ADS] [CrossRef] [EDP Sciences] [Google Scholar]
- Klessen, R. S., Heitsch, F., & Mac Low, M.-M. 2000, ApJ, 535, 887 [NASA ADS] [CrossRef] [Google Scholar]
- Könyves, V., André, P., Men’shchikov, A., et al. 2015, A&A, 584, A91 [NASA ADS] [CrossRef] [EDP Sciences] [Google Scholar]
- Kudoh, T., & Basu, S. 2003, ApJ, 595, 842 [NASA ADS] [CrossRef] [Google Scholar]
- Kudoh, T., & Basu, S. 2006, ApJ, 642, 270 [NASA ADS] [CrossRef] [Google Scholar]
- Kudoh, T., Basu, S., Ogata, Y., & Yabe, T. 2007, MNRAS, 380, 499 [NASA ADS] [CrossRef] [Google Scholar]
- Kunz, M. W., & Mouschovias, T. C. 2009, MNRAS, 399, L94 [NASA ADS] [Google Scholar]
- Li, P. S., McKee, C. F., & Klein, R. I. 2015, MNRAS, 452, 2500 [NASA ADS] [CrossRef] [Google Scholar]
- McDaniel, E. W., & Mason, E. A. 1973, Mobility and Diffusion of Ions in Gases (USA: John Wiley and Sons) [Google Scholar]
- Mercimek, S., Myers, P. C., Lee, K. I., & Sadavoy, S. I. 2017, AJ, 153, 214 [NASA ADS] [CrossRef] [Google Scholar]
- Mestel, L. 1965, QJRAS, 6, 265 [NASA ADS] [Google Scholar]
- Mouschovias, T. C. 1976a, ApJ, 206, 753 [NASA ADS] [CrossRef] [Google Scholar]
- Mouschovias, T. C. 1976b, ApJ, 207, 141 [NASA ADS] [CrossRef] [Google Scholar]
- Mouschovias, T. C. 1991, ApJ, 373, 169 [NASA ADS] [CrossRef] [Google Scholar]
- Myers, P. C., & Basu, S. 2021, ApJ, submitted [arXiv:2104.02597] [Google Scholar]
- Myers, P. C., & Benson, P. J. 1983, ApJ, 266, 309 [NASA ADS] [CrossRef] [Google Scholar]
- Myers, P. C., Linke, R. A., & Benson, P. J. 1983, ApJ, 264, 517 [NASA ADS] [CrossRef] [Google Scholar]
- Nakamura, F., & Li, Z.-Y. 2005, ApJ, 631, 411 [NASA ADS] [CrossRef] [Google Scholar]
- Nakano, T., & Nakamura, T. 1978, PASJ, 30, 671 [NASA ADS] [Google Scholar]
- Osterbrock, D. E. 1961, ApJ, 134, 347 [NASA ADS] [CrossRef] [Google Scholar]
- Pattle, K., & Fissel, L. 2019, Front. Astron. Space Sci., 6, 15 [CrossRef] [Google Scholar]
- Planck Collaboration Int. XXXV. 2016, A&A, 586, A138 [NASA ADS] [CrossRef] [EDP Sciences] [Google Scholar]
- Pokhrel, R., Myers, P. C., Dunham, M. M., et al. 2018, ApJ, 853, 5 [NASA ADS] [CrossRef] [Google Scholar]
- Sadavoy, S. I., Di Francesco, J., Bontemps, S., et al. 2010, ApJ, 710, 1247 [NASA ADS] [CrossRef] [Google Scholar]
- Sadavoy, S. I., Di Francesco, J., André, P., et al. 2014, ApJ, 787, L18 [Google Scholar]
- Tielens, A. G. G. M. 2005, The Physics and Chemistry of the Interstellar Medium [CrossRef] [Google Scholar]
- Vazquez-Semadeni, E., Passot, T., & Pouquet, A. 1996, ApJ, 473, 881 [NASA ADS] [CrossRef] [Google Scholar]
- Ward-Thompson, D., Scott, P. F., Hills, R. E., & Andre, P. 1994, MNRAS, 268, 276 [Google Scholar]
- Ward-Thompson, D., André, P., Crutcher, R., et al. 2007, in Protostars and Planets V, eds. B. Reipurth, D. Jewitt, & K. Keil, 33 [Google Scholar]
Appendix A: System of equations
We formulate model clouds as rotating, self-gravitating, partially ionized, isothermal, magnetic, planar thin sheets with infinite extent in the x- and y- directions and a local vertical half-thickness Z(x, y, t) (see Fig. 1 from Das & Basu 2021). In our model, we adopt a velocity unit of cs, the isothermal sound speed, and a column density unit of σn, 0, the initial uniform column density. The length unit is  , leading to a time unit t0 = cs/(2πGσn, 0), where G is the universal gravitational constant. The mass unit is
  and the magnetic field strength unit is B0 = 2πG1/2σn, 0. The free-fall time is
 (A.1)
(A.1)
where
 (A.2)
(A.2)
is the initial uniform local vertical half-thickness, with dimensionless form
 (A.3)
(A.3)
Here  is the dimensionless external pressure. The initial local effective sound speed, Ceff, 0, comes from
![Mathematical equation: $$ \begin{aligned} C^2_{\mathrm{eff,0}} = \frac{\pi }{2} G \sigma ^2_{n,0} \frac{\left[3P_{\mathrm{ext}}+ \frac{\pi }{2} G \sigma ^2_{n,0}\right]}{\left[P_{\mathrm{ext}}+\frac{\pi }{2} G \sigma ^2_{n,0}\right]^2} c_s ^2, \end{aligned} $$](/articles/aa/full_html/2021/05/aa40404-21/aa40404-21-eq36.gif) (A.4)
(A.4)
and reduces to the isothermal sound speed, cs, in the limit of very low Pext. It can be obtained from the linearized condition of vertical hydrostatic equilibrium:
 (A.5)
(A.5)
The initial uniform Alfvén speed VA, 0 is related to the mass-to-magnetic-flux ratio (μ0) via
 (A.6)
(A.6)
where ρn, 0 is the initial uniform volume density. The initial uniform ambipolar diffusivity can be expressed as (see Das & Basu 2021)
 (A.7)
(A.7)
Now, from the system of governing equations (see Eqs. (11)–(23) of Das & Basu 2021, which are the fundamental MHD equations obtained by integrating over the z-direction), we obtain a simplified form in x- and y- components:
 (A.8)
(A.8)
 (A.9)
(A.9)
 (A.10)
![Mathematical equation: $$ \begin{aligned} F_{\mathrm{Mag},x} &= \frac{B_{z, \mathrm{eq}}}{2\pi } \left(B_{x,Z} - Z \frac{\partial B_{z, \mathrm{eq}}}{\partial x} \right) \nonumber \\&+ \frac{1}{4\pi } \frac{\partial Z}{\partial x} \Biggr [B^2_{x,Z} +B^2_{{ y},Z} + 2 B_{z,\mathrm{eq}} \left(B_{x,Z} \frac{\partial Z}{\partial x}+ B_{{ y},Z} \frac{\partial Z}{\partial { y}} \right)\nonumber \\&+ \left(B_{x,Z} \frac{\partial Z}{\partial x}+ B_{{ y},Z} \frac{\partial Z}{\partial { y}} \right) ^2 \Biggr ], \end{aligned} $$](/articles/aa/full_html/2021/05/aa40404-21/aa40404-21-eq43.gif) (A.11)
(A.11)
![Mathematical equation: $$ \begin{aligned} F_{\mathrm{Mag},{ y}} &= \frac{B_{z, \mathrm{eq}}}{2\pi } \left(B_{{ y},Z} - Z \frac{\partial B_{z, \mathrm{eq}}}{\partial { y}}\right) \nonumber \\&+ \frac{1}{4\pi } \frac{\partial Z}{\partial { y}} \Bigg [B^2_{x,Z} +B^2_{{ y},Z} + 2 B_{z,\mathrm{eq}} \left(B_{x,Z} \frac{\partial Z}{\partial x}+ B_{{ y},Z} \frac{\partial Z}{\partial { y}}\right)\nonumber \\&\quad + \left(B_{x,Z} \frac{\partial Z}{\partial x}+ B_{{ y},Z} \frac{\partial Z}{\partial { y}} \right)^2 \Bigg ], \end{aligned} $$](/articles/aa/full_html/2021/05/aa40404-21/aa40404-21-eq44.gif) (A.12)
(A.12)
![Mathematical equation: $$ \begin{aligned} \frac{\partial B_{z,\mathrm{eq}}}{\partial t} = -\frac{\partial }{\partial x} &\left(B_{z,\mathrm{eq}} { v}_{i,x} \right) -\frac{\partial }{\partial { y}} \left(B_{z,\mathrm{eq}} { v}_{i,{ y}} \right)\nonumber \\&+ \left[\frac{\partial }{\partial x}\left(\eta _{\mathrm{OD}} \frac{\partial B_{z,\mathrm{eq}}}{\partial x}\right)+ \frac{\partial }{\partial { y}} \left(\eta _{\mathrm{OD}} \frac{\partial B_{z,\mathrm{eq}}}{\partial { y}}\right)\right]. \end{aligned} $$](/articles/aa/full_html/2021/05/aa40404-21/aa40404-21-eq45.gif) (A.13)
(A.13)
where
 (A.14)
 (A.15)
Here, vi, x, vi, y, vn, x, and vn, y are the x- and y- components of ion and neutral velocities. The planar sheet is rotating with an angular velocity Ω about the z-axis, so that  . The magnetic field and rotation axis are perpendicular to the sheet. Here, ηOD,0 is the ohmic diffusivity that is considered as a measure of ohmic dissipation. Starting with a static uniform background, any physical quantity of the thin-sheet equations can be expanded by writing it via
 (A.16)
where f0 is the unperturbed background state, δfa is the amplitude of the perturbation, kx, ky, and k are the x-, y-, and z- wavenumbers, respectively, and ω is the complex angular frequency. For assumed small-amplitude perturbations such that |δfa| ≪ f0, and retaining the linearized form of the perturbed quantities from Eqs. (A.8)–(A.10) and (A.13), the following equations are obtained:
 (A.17)
![Mathematical equation: $$ \begin{aligned} \omega c_{\rm s} \delta { v}\prime _{n,x} =&\frac{k_x}{k} \left[C_{\mathrm{eff,0}} ^2 k - 2 \pi G \sigma _{n,0} \right] \delta \sigma \prime _{n} + i 2\Omega c_{\rm s} \delta { v}\prime _{n,{ y}} \nonumber \\&+ \frac{k_x}{k} \left[ 2 \pi G \sigma _{n,0} \mu _0 ^{-1} + k V_{A,0} ^2 \mu _0 \right] \delta B\prime _{z,\mathrm{eq}} , \end{aligned} $$](/articles/aa/full_html/2021/05/aa40404-21/aa40404-21-eq51.gif) (A.18)
(A.18)
![Mathematical equation: $$ \begin{aligned} \omega c_{\rm s} \delta { v}\prime _{n,{ y}} =&\frac{k_{ y}}{k} \left[C_{\mathrm{eff,0}} ^2 k - 2 \pi G \sigma _{n,0}\right] \delta \sigma \prime _{n} - i 2\Omega c_{\rm s} \delta { v}\prime _{n,x} \nonumber \\&+ \frac{k_{ y}}{k} \left[ 2 \pi G \sigma _{n,0} \mu _0 ^{-1} + k V_{A,0} ^2 \mu _0 \right] \delta B\prime _{z, \mathrm{eq}} , \end{aligned} $$](/articles/aa/full_html/2021/05/aa40404-21/aa40404-21-eq52.gif) (A.19)
(A.19)
![Mathematical equation: $$ \begin{aligned} \omega &\delta B\prime _{z, \mathrm{eq}} = \frac{k_x}{\mu _0} c_{\rm s} \delta { v}\prime _{n,x} + \frac{k_{ y}}{\mu _0} c_{\rm s} \delta { v}\prime _{n,{ y}} \nonumber \\&- i \left[\eta _{\rm OD,0}k^2 + \tau _{\mathrm{ni},0} \left(2\pi G \sigma _{n,0} \mu _0 ^{-2}k + k^2 V_{A,0}^2 \right)\right] \delta B\prime _{z,\mathrm{eq}} , \end{aligned} $$](/articles/aa/full_html/2021/05/aa40404-21/aa40404-21-eq53.gif) (A.20)
(A.20)
where the perturbed eigenfunctions δσn, δvn, x (and δvn, y), δBz, eq are normalized by σn, 0, cs, and B0 (= 2πG1/2σn, 0), respectively, such that  ,
,  ,
,  , and
, and  . Now, finding the determinant from the above set of equations one obtains the full dispersion relation
![Mathematical equation: $$ \begin{aligned} \left(\omega + i [\theta + \gamma ] \right) \big (\omega ^2 &- C^2_{\mathrm{eff,0}} k^2 + 2\pi G \sigma _{n,0} k - 4\Omega ^2 \big ) \nonumber \\&= \omega \left[2\pi G \sigma _{n,0} k \mu _0 ^{-2} + k^2 V^2 _{A,0} \right] \;. \end{aligned} $$](/articles/aa/full_html/2021/05/aa40404-21/aa40404-21-eq58.gif) (A.21)
(A.21)
This is derived in Das & Basu (2021; see Eq. (47)), where
 (A.22)
which is same as Eq. (45) of Das & Basu (2021), and θ is described earlier (see Eq. (5) and Eq. (46) of Das & Basu (2021)). Finally, the dispersion relation (see Eq. (4)) is the same as the Eq. (A.21) when setting Ω = 0 and ηOD,0 = 0. In the above, we discuss all the equations in detail for completeness and clarity of our model. See also Eqs. (32)a–d of Ciolek & Basu (2006) for the dimensionless representation of the Eqs. (A.17)–(A.20) for the model with Ω = 0 and ηOD,0 = 0; also see Eqs. (10)–(13) of Bailey & Basu (2012) for the dimensional representation of Eq. (A.17)–(A.20) for the same model.
Based on these parameters, typical values of the units used and other derived quantities are
 (A.23)
 (A.24)
 (A.25)
 (A.26)
 (A.27)
 (A.28)
 (A.29)
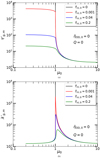 |
Fig. A.1. Top: normalized shortest growth time of gravitationally unstable mode ( |


Appendix B: Tables
Fitting data for calculating the lifetime of prestellar cores.
Fitting data for calculating the number of enclosed cores (NumCORE).
All Tables
All Figures
|
Fig. 1. Growth timescale τg, m (in the units of dynamical or free-fall time tff) and the preferred fragmentation mass Mg, m (in the units of preferred thermal fragmentation mass MT, m) of the most unstable mode as a function of the normalized mass-to-flux ratio (μ0). The model utilizes the standard ionization fraction corresponding to a normalized neutral–ion collision time |
| In the text | |
|
Fig. 2. Estimated lifetime as a function of number density (nn). The green filled squares are obtained from our model for a normalized neutral–ion collision time |
| In the text | |
|
Fig. 3. Number of enclosed cores (log[NumCORE]) as a function of Jeans number (log[NJ, CLUMP]) of clumps. The blue filled circles represent the observed number of enclosed cores as found by Pokhrel et al. (2018). The green filled crosses are obtained from our model for a normalized neutral–ion collision time |
| In the text | |
|
Fig. 4. Magnetic field log(Bref/μG) vs. number density |
| In the text | |
|
Fig. A.1. Top: normalized shortest growth time of gravitationally unstable mode ( |
| In the text | |
Current usage metrics show cumulative count of Article Views (full-text article views including HTML views, PDF and ePub downloads, according to the available data) and Abstracts Views on Vision4Press platform.
Data correspond to usage on the plateform after 2015. The current usage metrics is available 48-96 hours after online publication and is updated daily on week days.
Initial download of the metrics may take a while.