Fig. 2.
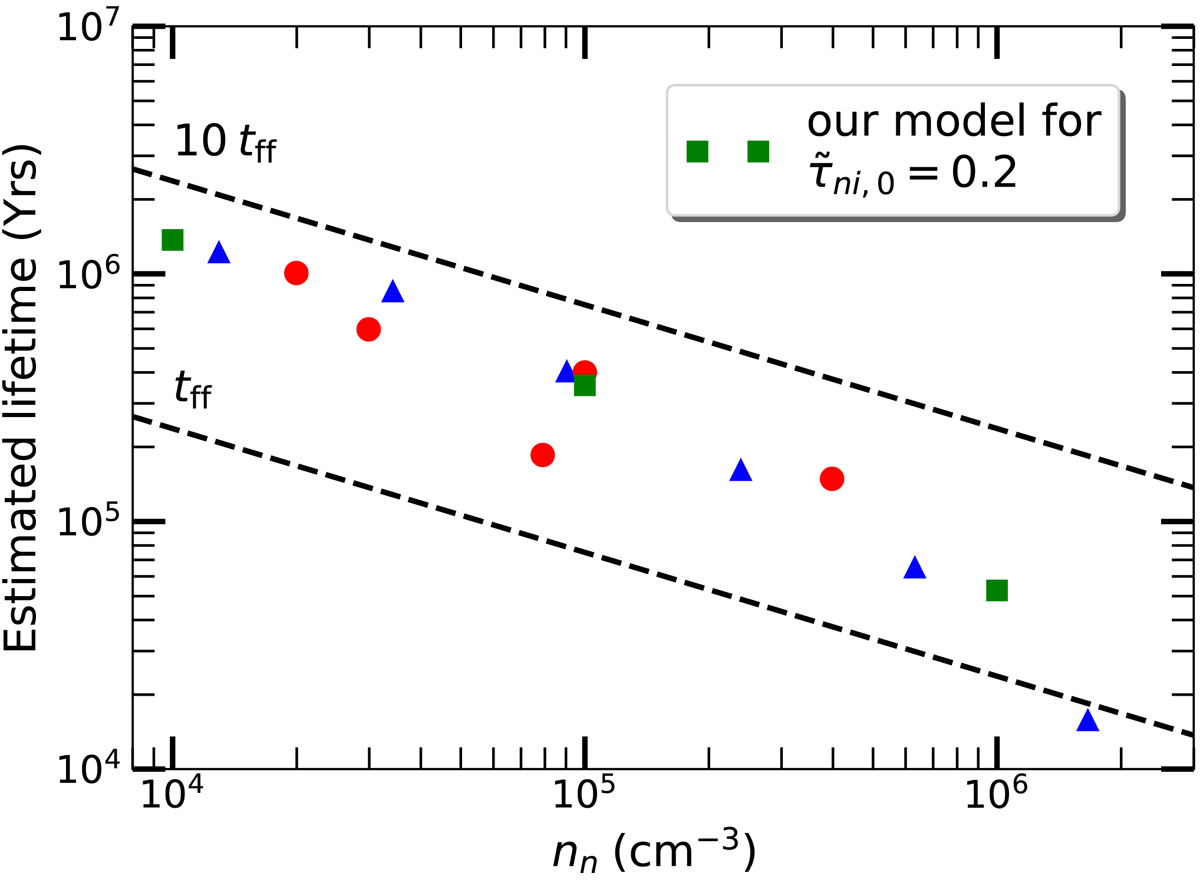
Estimated lifetime as a function of number density (nn). The green filled squares are obtained from our model for a normalized neutral–ion collision time ![]() . The blue filled triangles show the corresponding data points for the population of 446 candidate prestellar cores identified with Herschel in the Aquila cloud (Könyves et al. 2015). Earlier data from Ward-Thompson et al. (2007) are shown by the red circles for better comparison. The black dashed line shows the dynamical time (Z0/cs), i.e., the free-fall time, of our model.
. The blue filled triangles show the corresponding data points for the population of 446 candidate prestellar cores identified with Herschel in the Aquila cloud (Könyves et al. 2015). Earlier data from Ward-Thompson et al. (2007) are shown by the red circles for better comparison. The black dashed line shows the dynamical time (Z0/cs), i.e., the free-fall time, of our model.
Current usage metrics show cumulative count of Article Views (full-text article views including HTML views, PDF and ePub downloads, according to the available data) and Abstracts Views on Vision4Press platform.
Data correspond to usage on the plateform after 2015. The current usage metrics is available 48-96 hours after online publication and is updated daily on week days.
Initial download of the metrics may take a while.