Fig. 4.
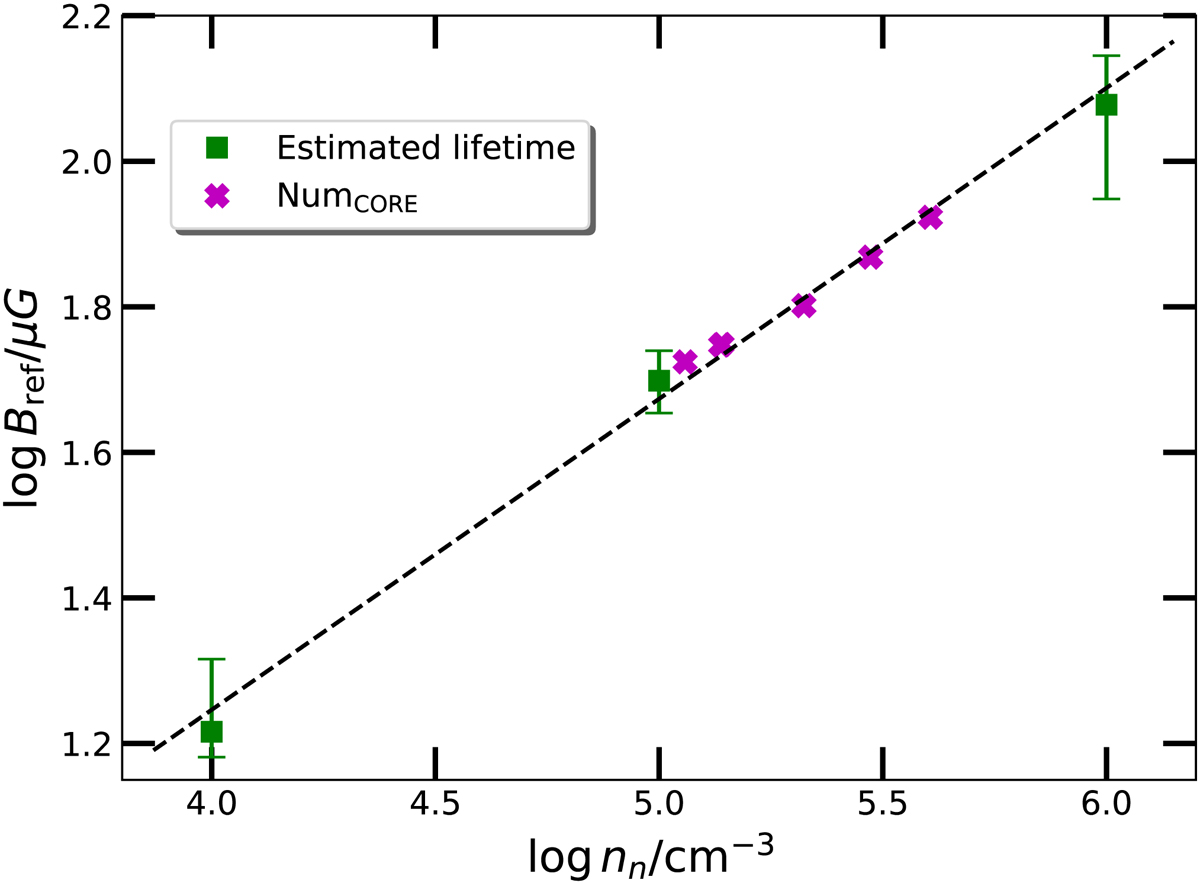
Magnetic field log(Bref/μG) vs. number density ![]() . The filled squares and crosses represent the number density region corresponding to the fitting of the lifetime of prestellar cores and NumCORE as shown in Figs. 2 and 3 (see Tables B.1 and B.2). The dashed line is the least-squares fit. The vertical error bars correspond to magnetic field variations that yield a total factor of two (greater or lesser by a factor
. The filled squares and crosses represent the number density region corresponding to the fitting of the lifetime of prestellar cores and NumCORE as shown in Figs. 2 and 3 (see Tables B.1 and B.2). The dashed line is the least-squares fit. The vertical error bars correspond to magnetic field variations that yield a total factor of two (greater or lesser by a factor ![]() ) values of the growth time (lifetime).
) values of the growth time (lifetime).
Current usage metrics show cumulative count of Article Views (full-text article views including HTML views, PDF and ePub downloads, according to the available data) and Abstracts Views on Vision4Press platform.
Data correspond to usage on the plateform after 2015. The current usage metrics is available 48-96 hours after online publication and is updated daily on week days.
Initial download of the metrics may take a while.