Fig. B.1.
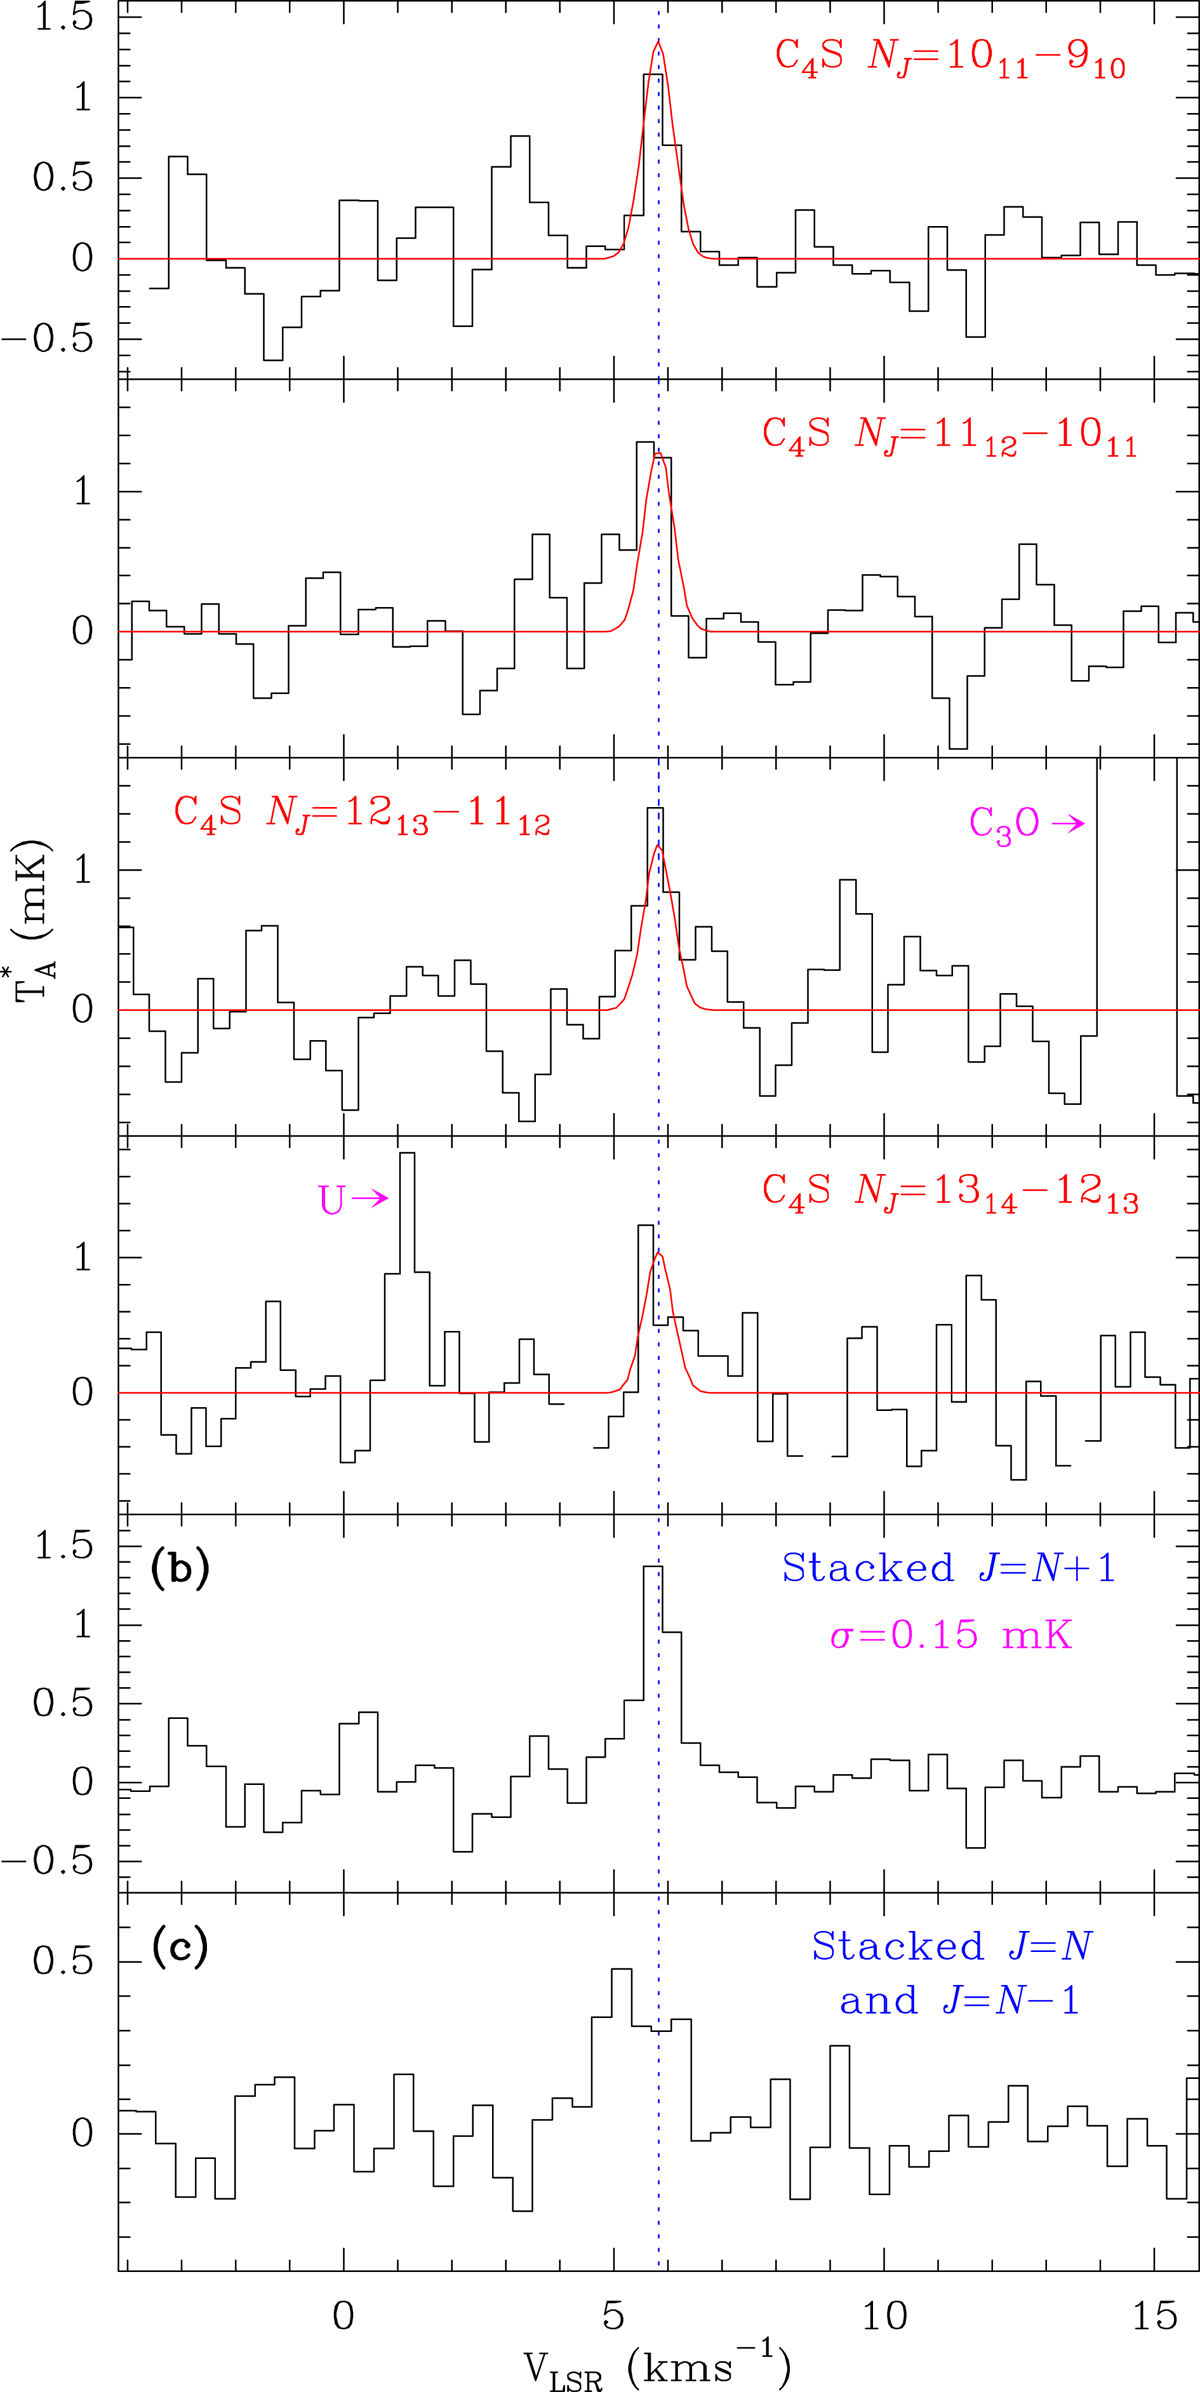
Four upper panels: individual lines of C4S with J = N + 1 detected in our survey. Two bottom panels: spectrum obtained after stacking all lines of C4S with J = N + 1 (panel b) and the resulting spectrum after stacking the twelve weak lines with J = N and J = N − 1 (panel c). The abscissa corresponds to the velocity with respect to the local standard of rest. The dashed blue line corresponds to vLSR = 5.83 km s−1. The ordinate is the antenna temperature in milliKelvin. The red line in the four upper panels corresponds to the synthetic spectrum for each transition computed with Tr = 7 K and N(C4S) = 3.8 × 1010 cm−2.
Current usage metrics show cumulative count of Article Views (full-text article views including HTML views, PDF and ePub downloads, according to the available data) and Abstracts Views on Vision4Press platform.
Data correspond to usage on the plateform after 2015. The current usage metrics is available 48-96 hours after online publication and is updated daily on week days.
Initial download of the metrics may take a while.