Fig. 2.
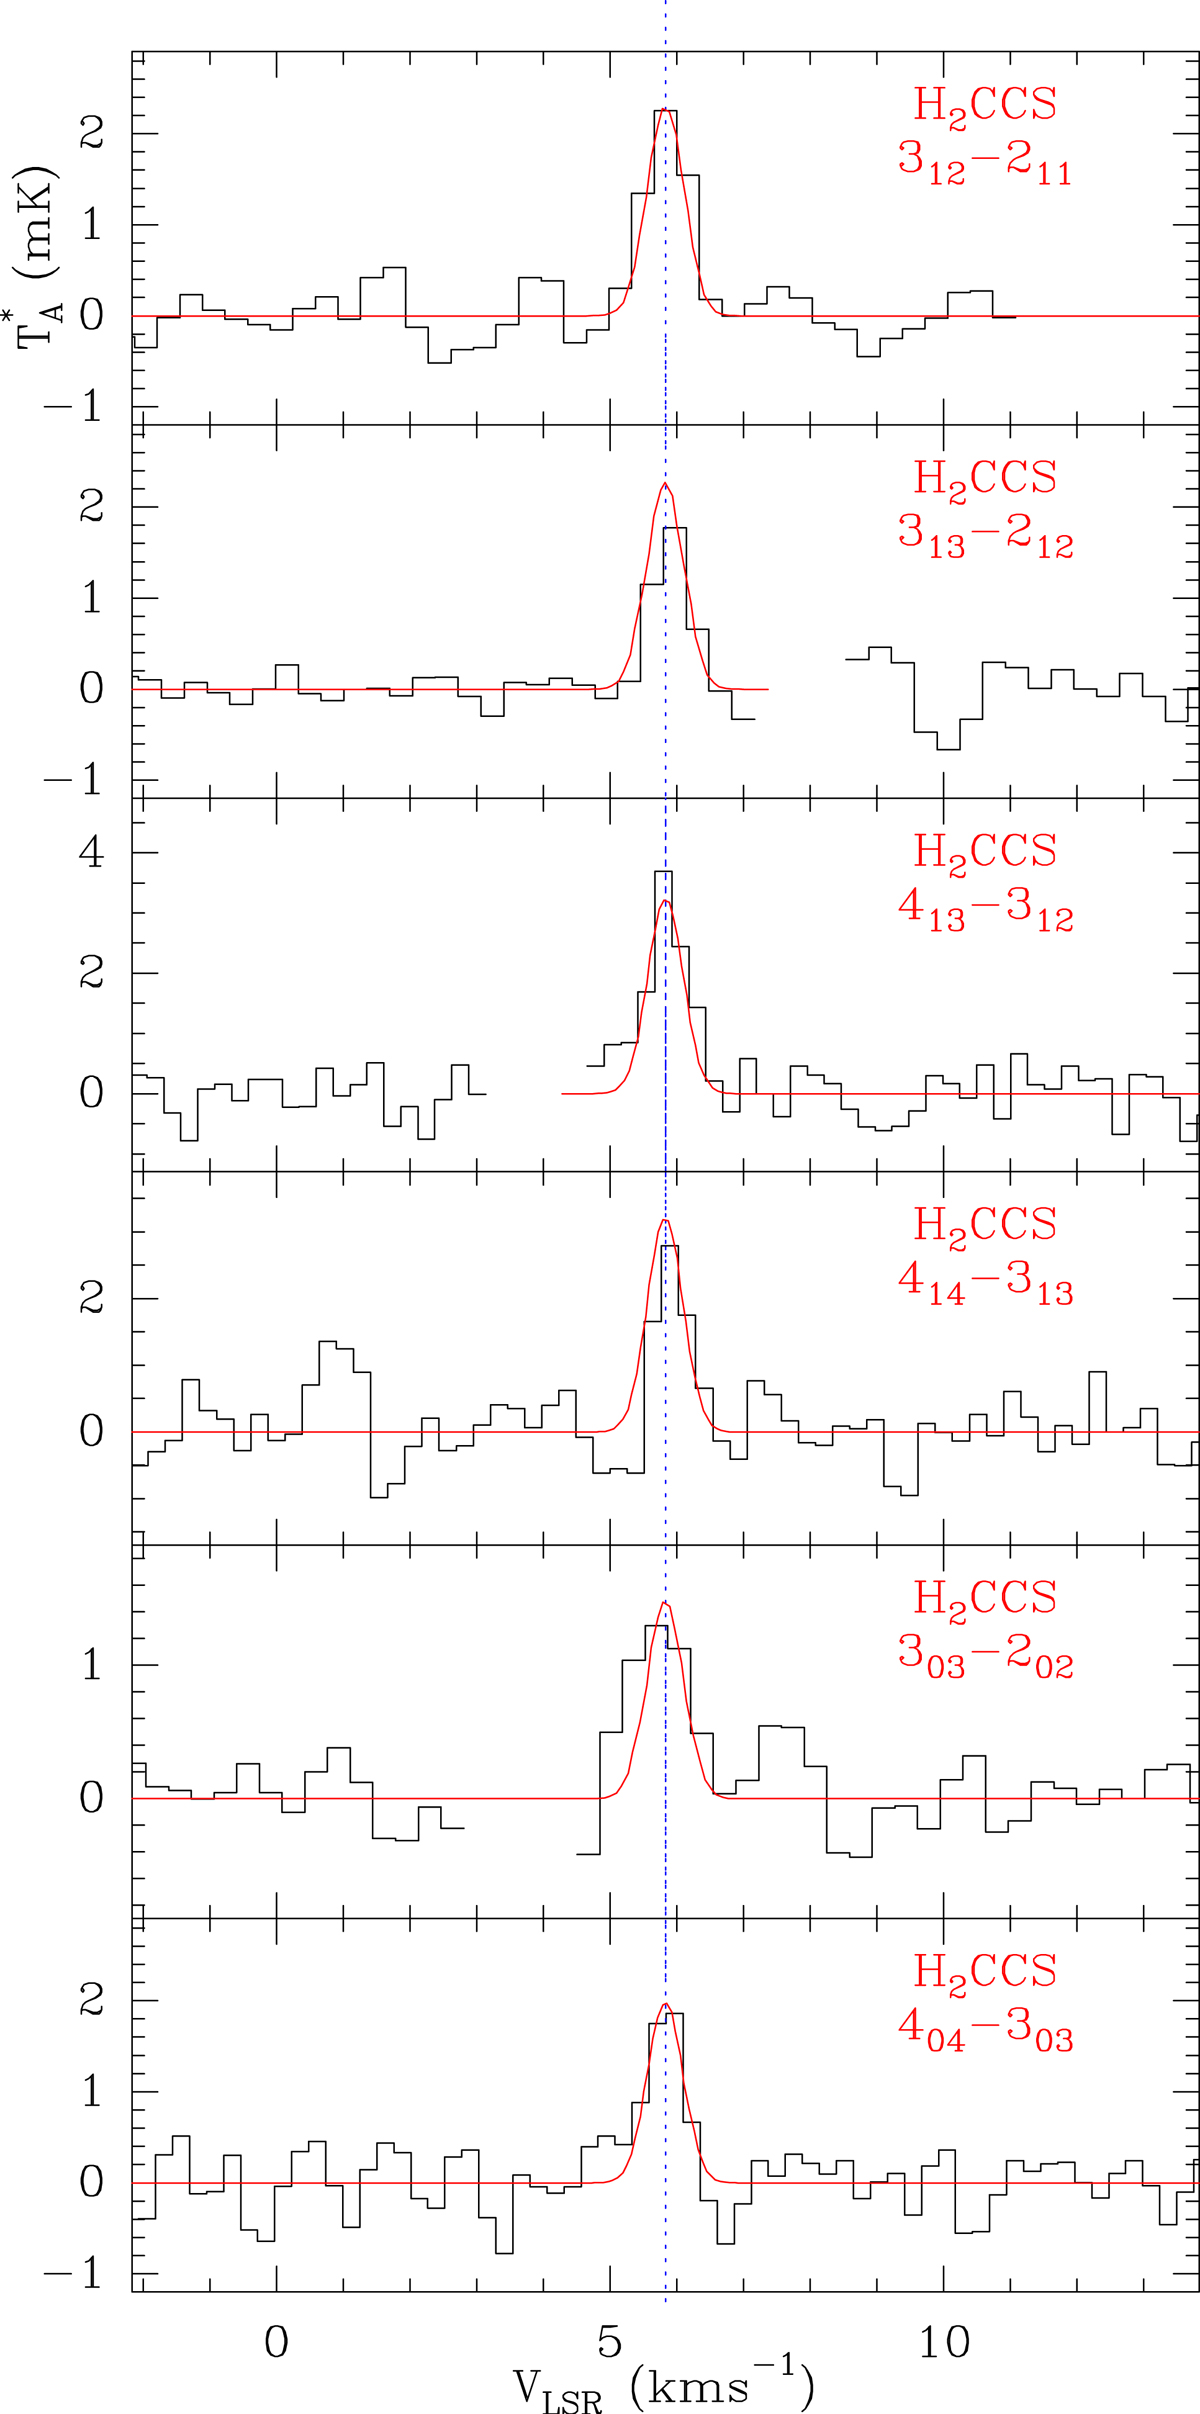
Observed transitions of H2CCS towards TMC-1. The abscissa corresponds to the velocity in km s−1 of the source with respect to the local standard of rest. Line parameters are given in Table D.1. The ordinate is the antenna temperature corrected for atmospheric and telescope losses in milliKelvin. Blanked channels correspond to negative features produced by the folding of the frequency switching observations. The vertical blue dashed line indicates the vLSR of the cloud (5.83 km s−1). The red line spectra correspond to the synthetic model spectrum for each line adopting Tr = 7 K, N(o-H2CCS) = 6.0 × 1011 cm−2, and N(p-H2CCS) = 1.8 × 1011 cm−2 (see text).
Current usage metrics show cumulative count of Article Views (full-text article views including HTML views, PDF and ePub downloads, according to the available data) and Abstracts Views on Vision4Press platform.
Data correspond to usage on the plateform after 2015. The current usage metrics is available 48-96 hours after online publication and is updated daily on week days.
Initial download of the metrics may take a while.