Fig. 1.
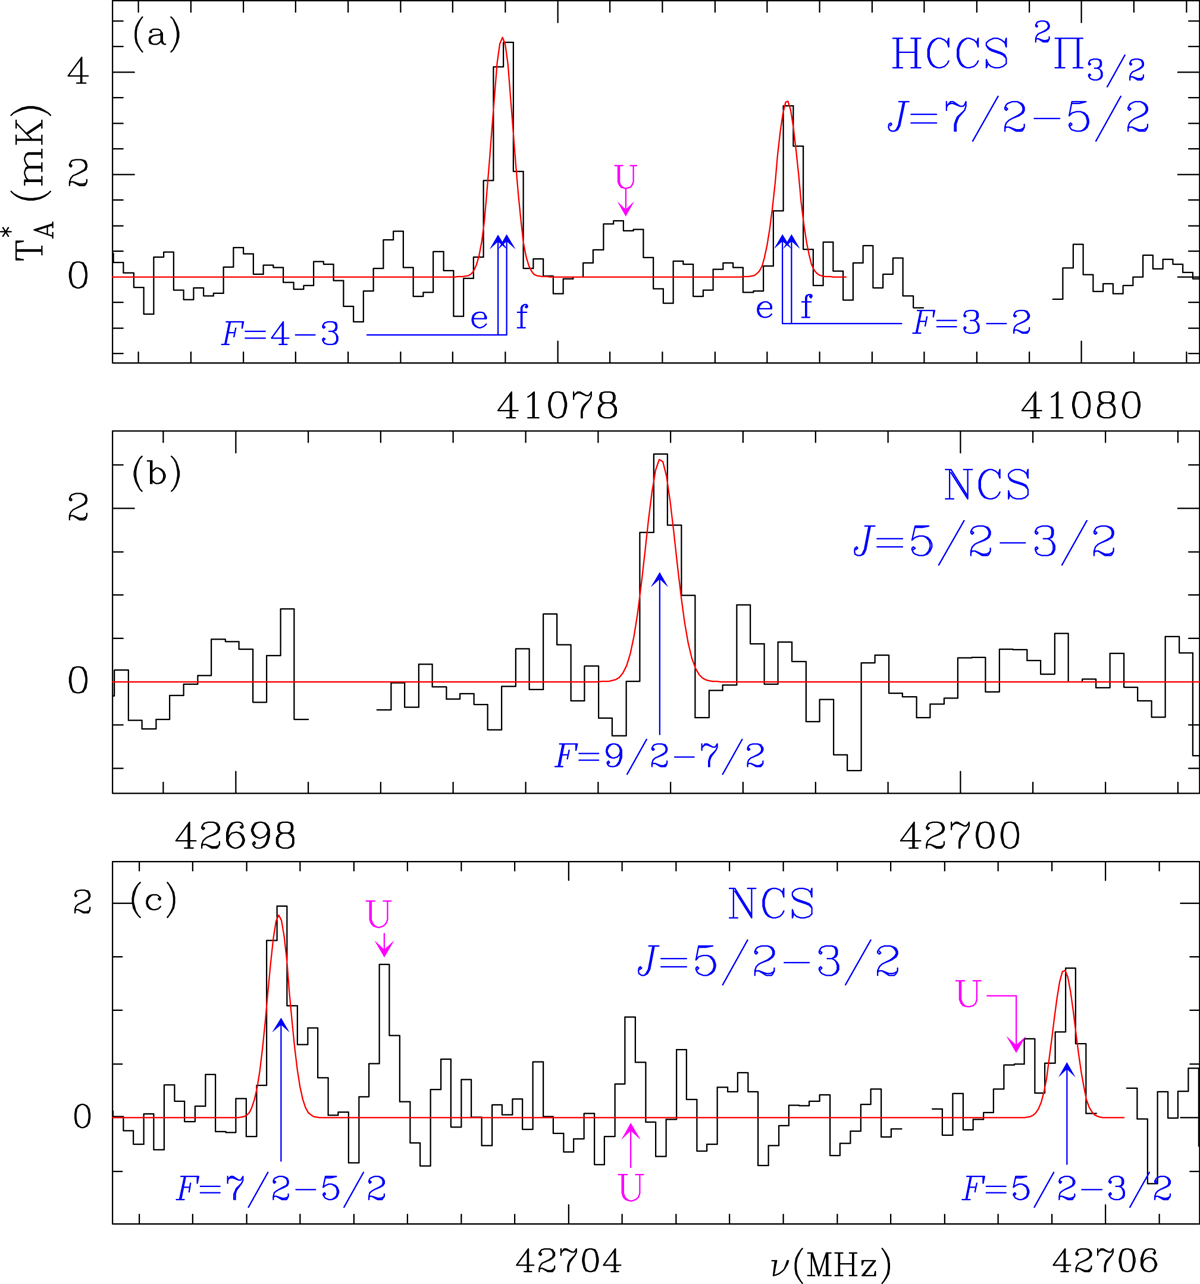
Observed lines of HCCS (panel a) and NCS (panels b and c) towards TMC-1. The abscissa corresponds to the rest frequency assuming a local standard of rest velocity of the source of 5.83 km s−1 (see text). Blanked channels correspond to negative features produced in the frequency switching data folding. The ordinate is the antenna temperature corrected for atmospheric and telescope losses in milliKelvin. Spectral resolution is 38.15 kHz. The red lines show the synthetic spectrum of HCCS and NCS for a rotational temperature of 5 K, a linewidth of 0.6 km s−1, and a column density of 6.8 × 1011 cm−2 and 7.8 × 1011 cm−2, respectively.
Current usage metrics show cumulative count of Article Views (full-text article views including HTML views, PDF and ePub downloads, according to the available data) and Abstracts Views on Vision4Press platform.
Data correspond to usage on the plateform after 2015. The current usage metrics is available 48-96 hours after online publication and is updated daily on week days.
Initial download of the metrics may take a while.