Fig. 6
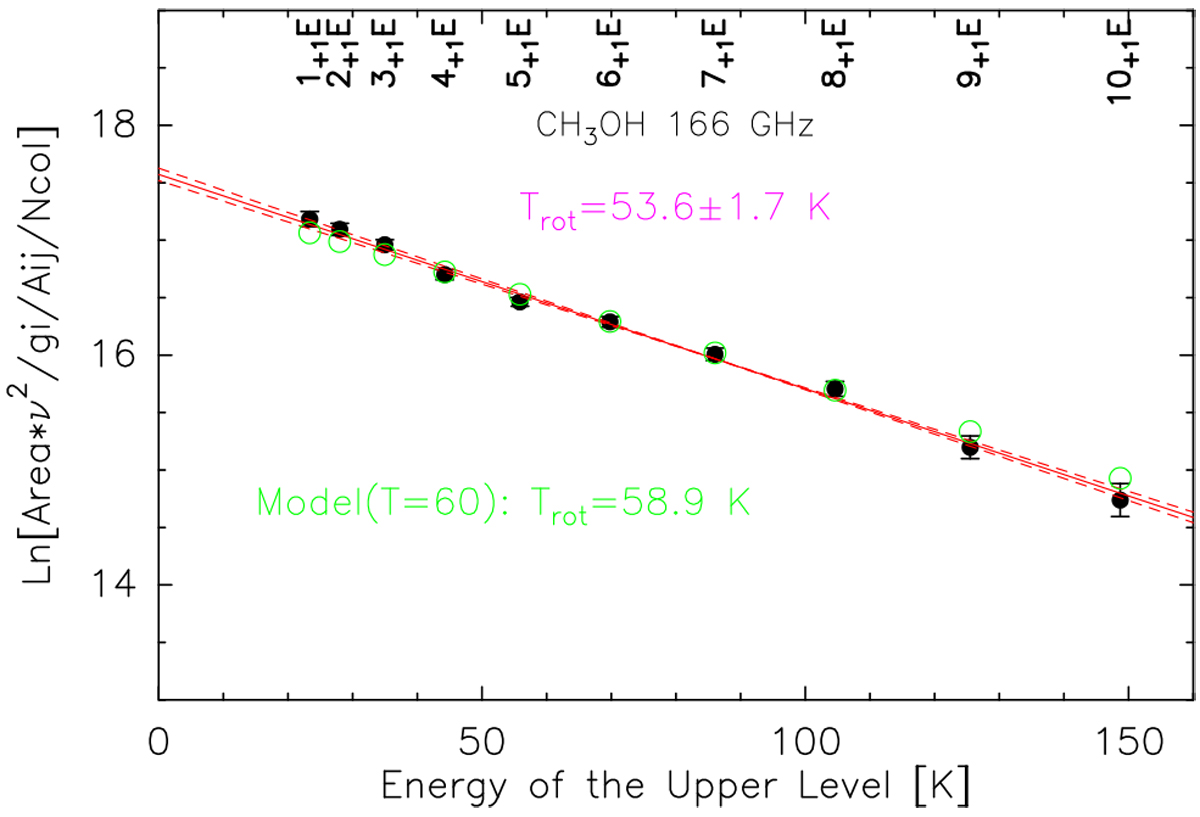
Rotational diagram of the 13–17 Dec average of the methanol lines around 166 GHz in comet 46P/Wirtanen. The neperian logarithm of a quantity proportional to the line intensity is plotted against the energy of the upper level of each transition. Fit is shown by solid red line and errors are displayed by red dashed lines. The black dots are the measurements and green circles the predicted values for a model with a gas temperature of 60 K.
Current usage metrics show cumulative count of Article Views (full-text article views including HTML views, PDF and ePub downloads, according to the available data) and Abstracts Views on Vision4Press platform.
Data correspond to usage on the plateform after 2015. The current usage metrics is available 48-96 hours after online publication and is updated daily on week days.
Initial download of the metrics may take a while.