Fig. 12
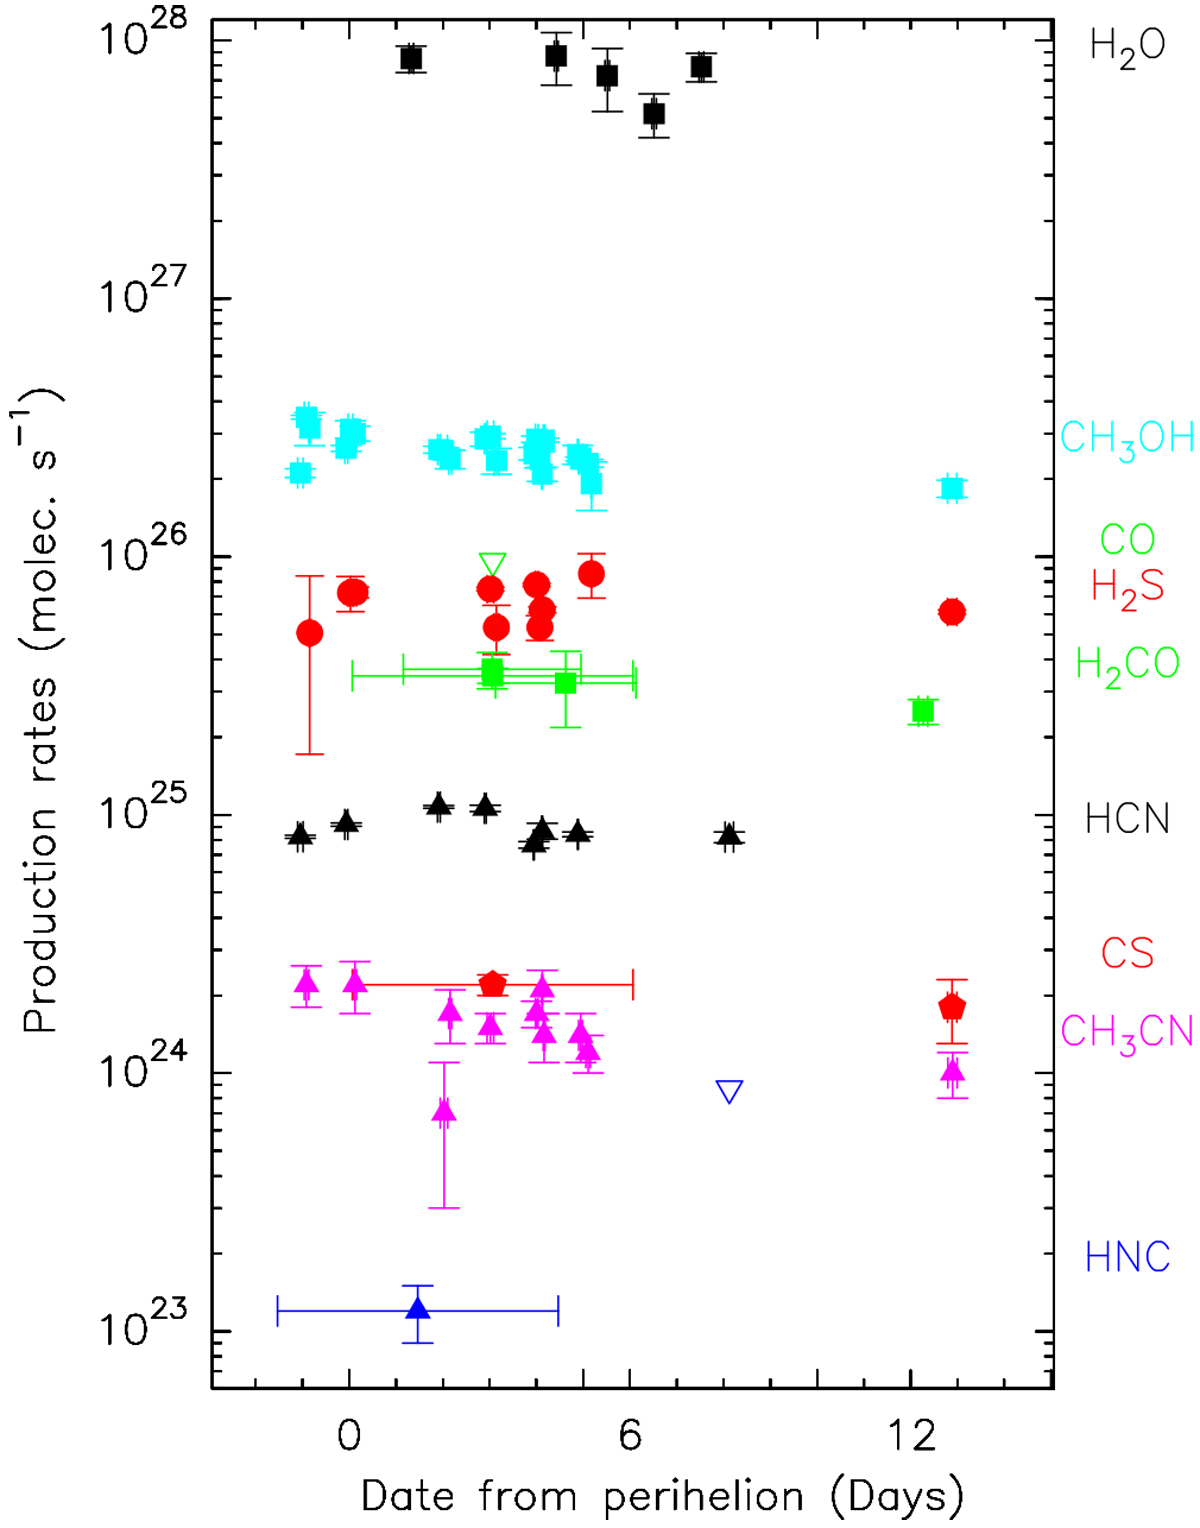
Evolution of production rates in comet 46P/Wirtanen between 12 and 25 December 2019 (perihelionwas on 12.9 Dec.) for the nine main molecules. Downward-pointing empty triangles are 3-σ upper limits. Coloured symbols are in the vertical order of the corresponding molecules’ names on the right. Water production rates have been computed from data in Lis et al. (2019).
Current usage metrics show cumulative count of Article Views (full-text article views including HTML views, PDF and ePub downloads, according to the available data) and Abstracts Views on Vision4Press platform.
Data correspond to usage on the plateform after 2015. The current usage metrics is available 48-96 hours after online publication and is updated daily on week days.
Initial download of the metrics may take a while.