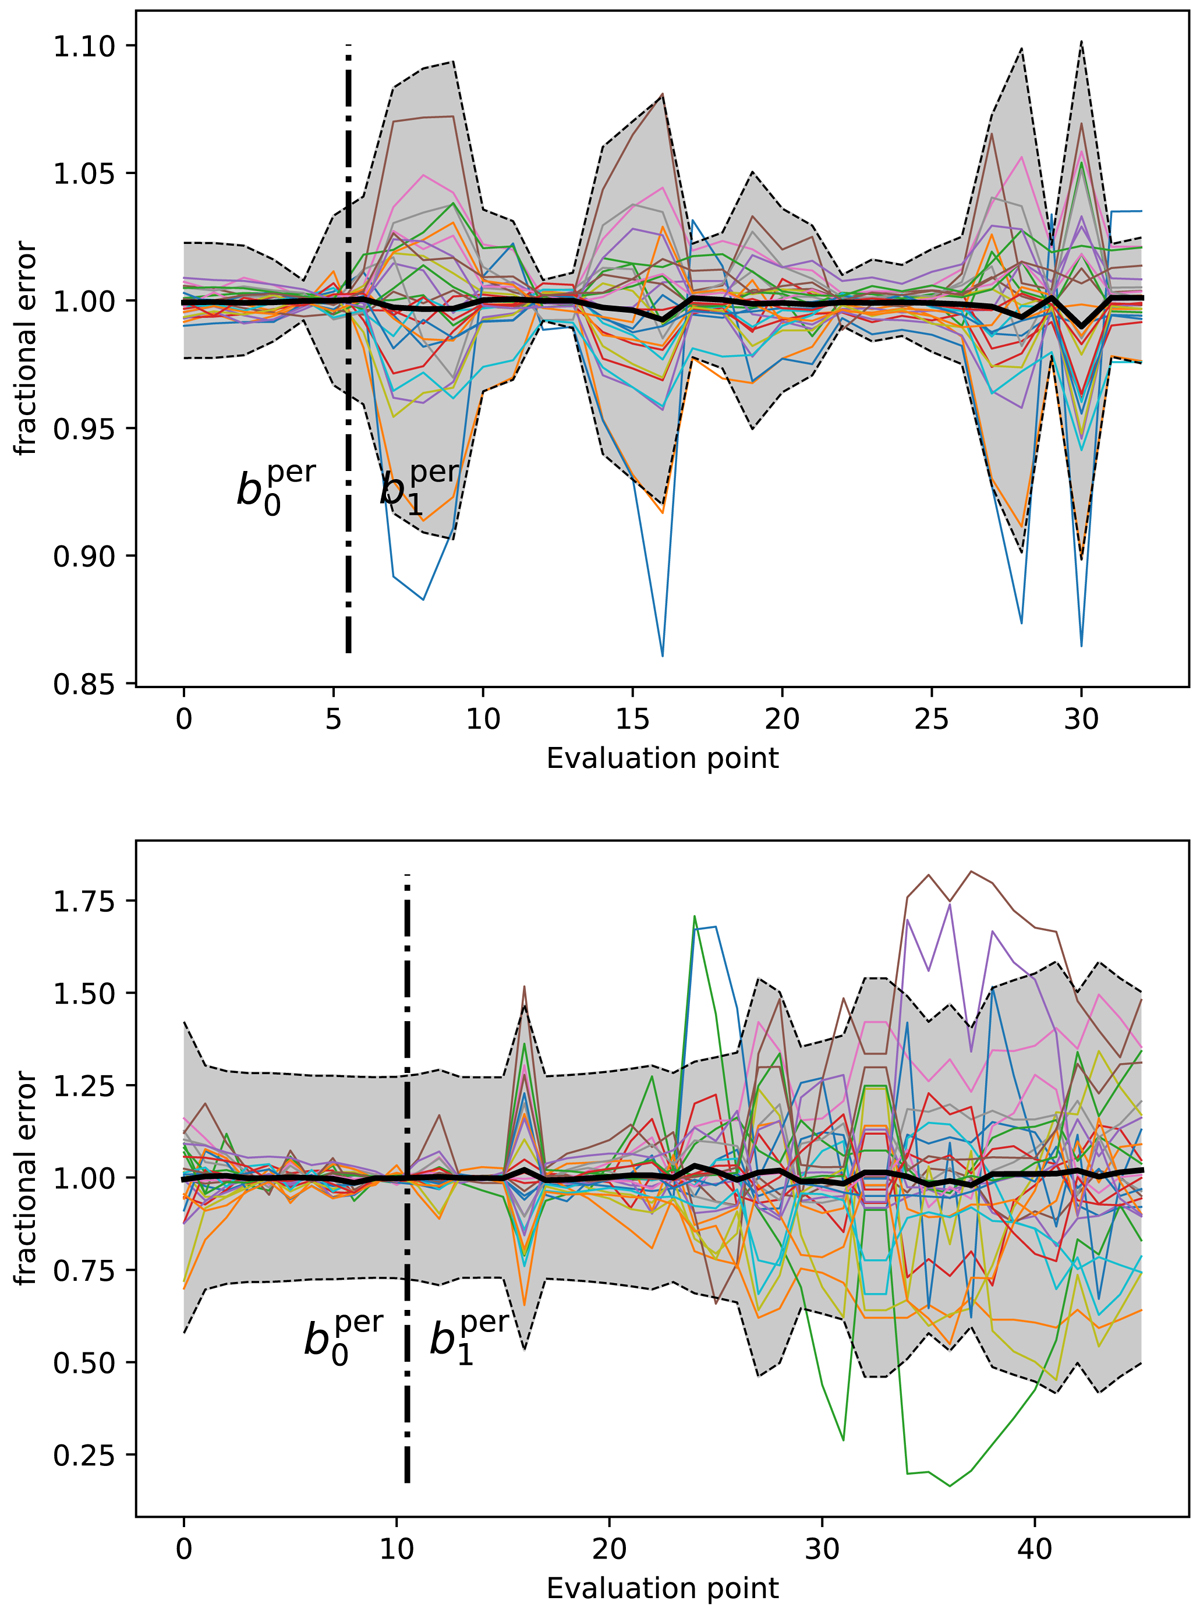
Fig. C.1.

Relative accuracy of the emulator for predicting the persistent Betti functions of a KV450-like (top) and a Euclid-like (bottom) survey. The thin-coloured lines represent the ratio between predicted and measured values for the 26 different cosmologies, estimated from a cross-validation test. The x-axis lists the points at which the functions are evaluated (see Table B.1 for their numerical values). The thick black line corresponds to the mean over all lines. The grey shaded area corresponds to the 1σ standard deviation of the covariance matrix extracted from SLICS.
Current usage metrics show cumulative count of Article Views (full-text article views including HTML views, PDF and ePub downloads, according to the available data) and Abstracts Views on Vision4Press platform.
Data correspond to usage on the plateform after 2015. The current usage metrics is available 48-96 hours after online publication and is updated daily on week days.
Initial download of the metrics may take a while.


