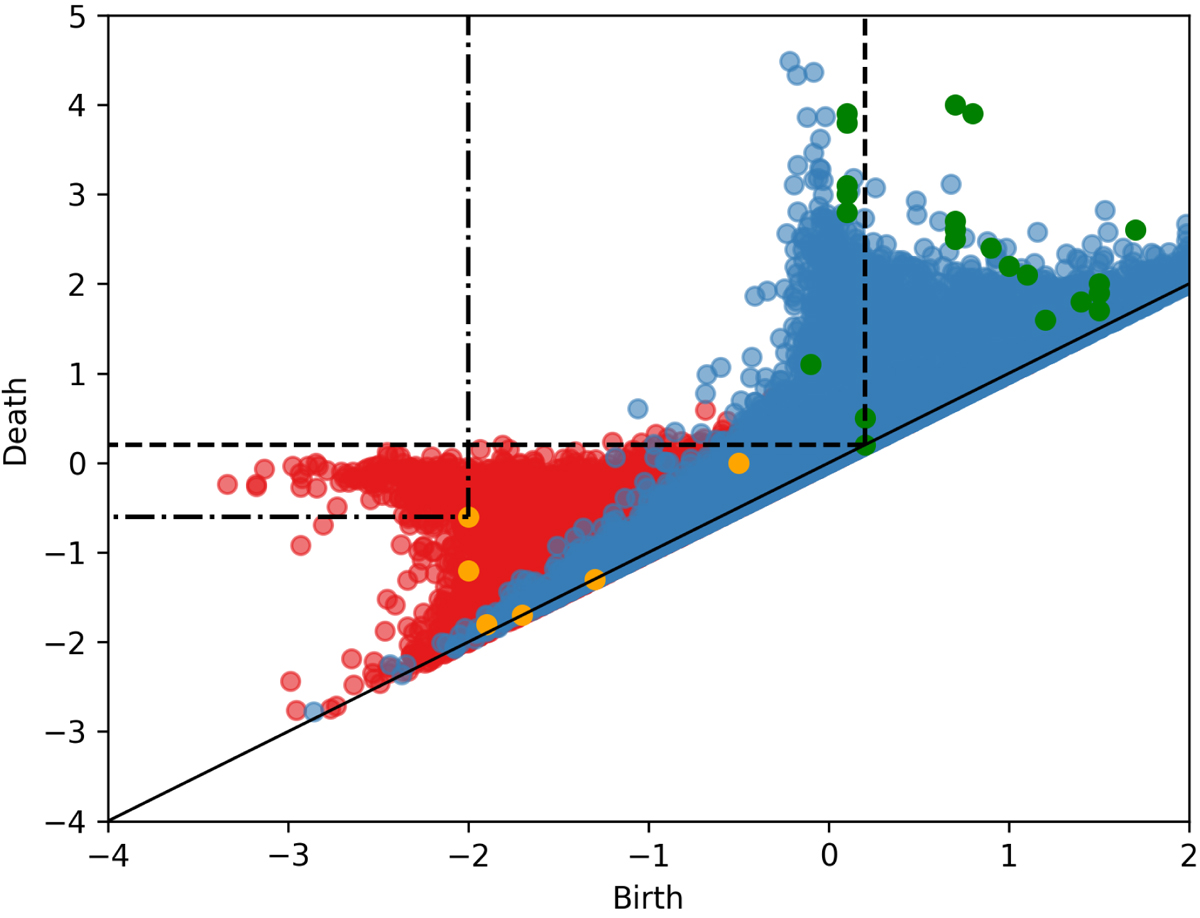
Fig. B.1.

Persistence diagram extracted from one tile Ti of the SLICS, in the KV450-like setup. The scattered points represent the features in Dgm(H0(𝕏)) (red) and Dgm(H1(𝕏)) (blue). For each feature, the x-value corresponds to the S/N-level at which that feature is born, whereas the y-value corresponds to the S/N-level at which it disappears again. The orange and green dots mark our evaluation points of the respective persistent Betti functions ![]() . The two dashed rectangles visualise regions in the diagram inside of which all features are counted, when computing the Betti functions at the evaluation points ( − 2, −0.6) and (0.2, 0.2).
. The two dashed rectangles visualise regions in the diagram inside of which all features are counted, when computing the Betti functions at the evaluation points ( − 2, −0.6) and (0.2, 0.2).
Current usage metrics show cumulative count of Article Views (full-text article views including HTML views, PDF and ePub downloads, according to the available data) and Abstracts Views on Vision4Press platform.
Data correspond to usage on the plateform after 2015. The current usage metrics is available 48-96 hours after online publication and is updated daily on week days.
Initial download of the metrics may take a while.


