Fig. 5
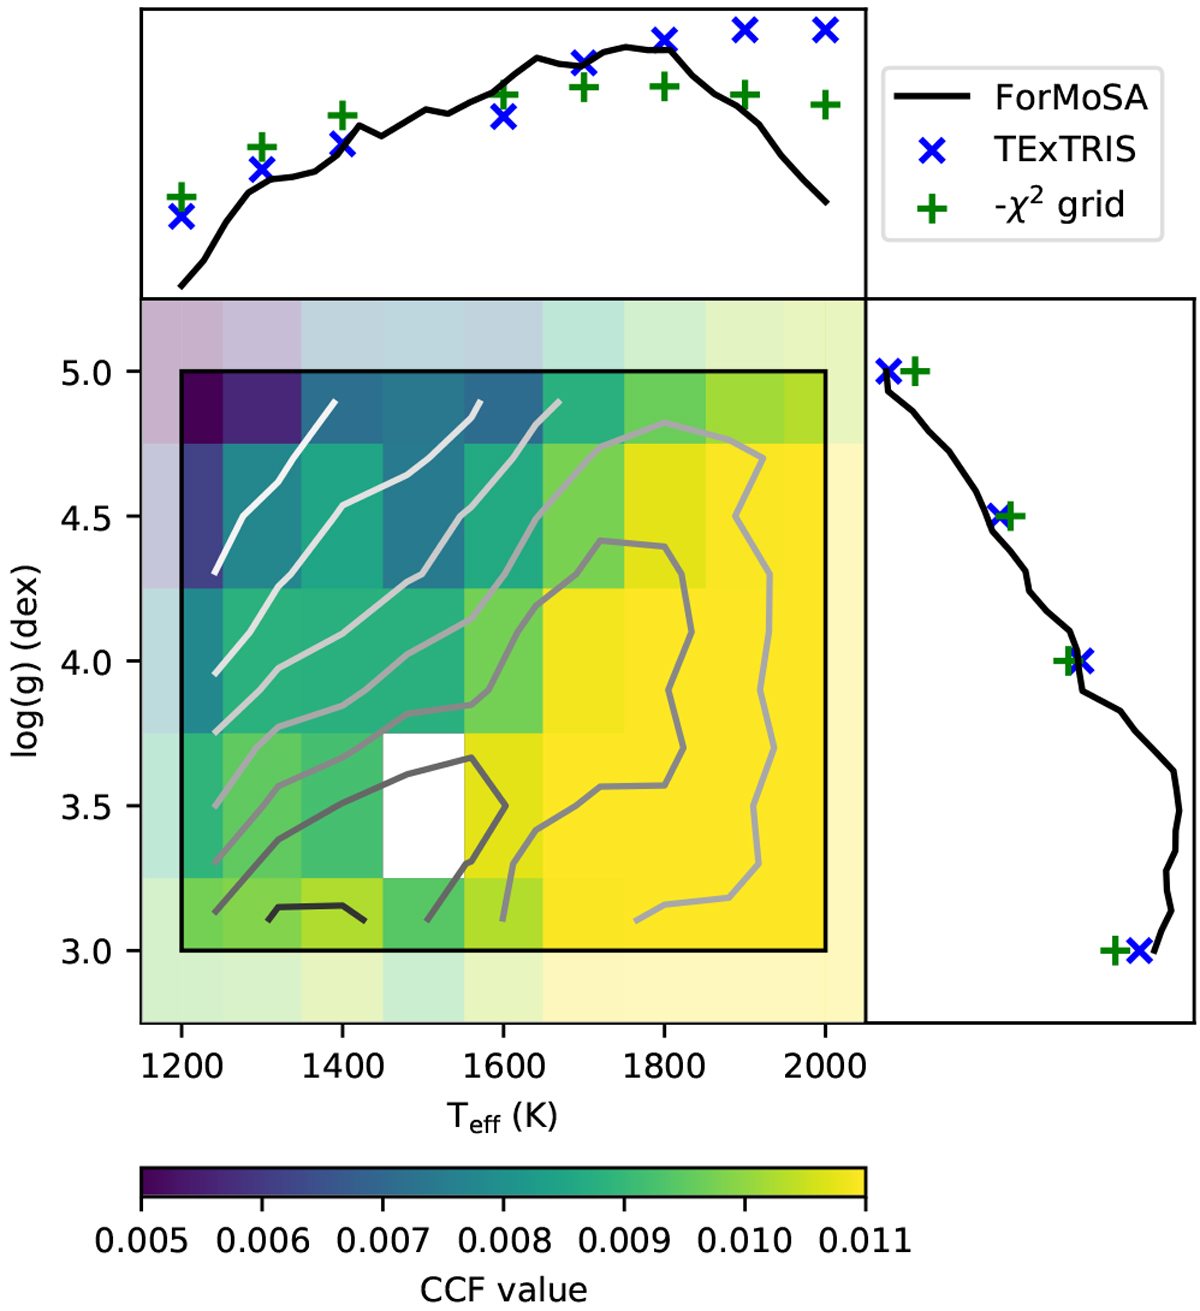
Comparison of the correlation signal of each spectrum of the grid BT-SETTL15 obtained with TExTRIS (color map) and the 2D posterior obtained with ForMoSA (gray contours). We also compare the normalized 1D posterior obtained with ForMoSA on the K band without the continuum (black line) with the normalized 1D pseudo-posteriors extracted from the correlation signal map (blue cross) and a χ2 map (green cross) for the Teff and the log(g) (top and right panel, respectively). The white rectangle corresponds to a nonconverged synthetic spectra.
Current usage metrics show cumulative count of Article Views (full-text article views including HTML views, PDF and ePub downloads, according to the available data) and Abstracts Views on Vision4Press platform.
Data correspond to usage on the plateform after 2015. The current usage metrics is available 48-96 hours after online publication and is updated daily on week days.
Initial download of the metrics may take a while.