Fig. 2
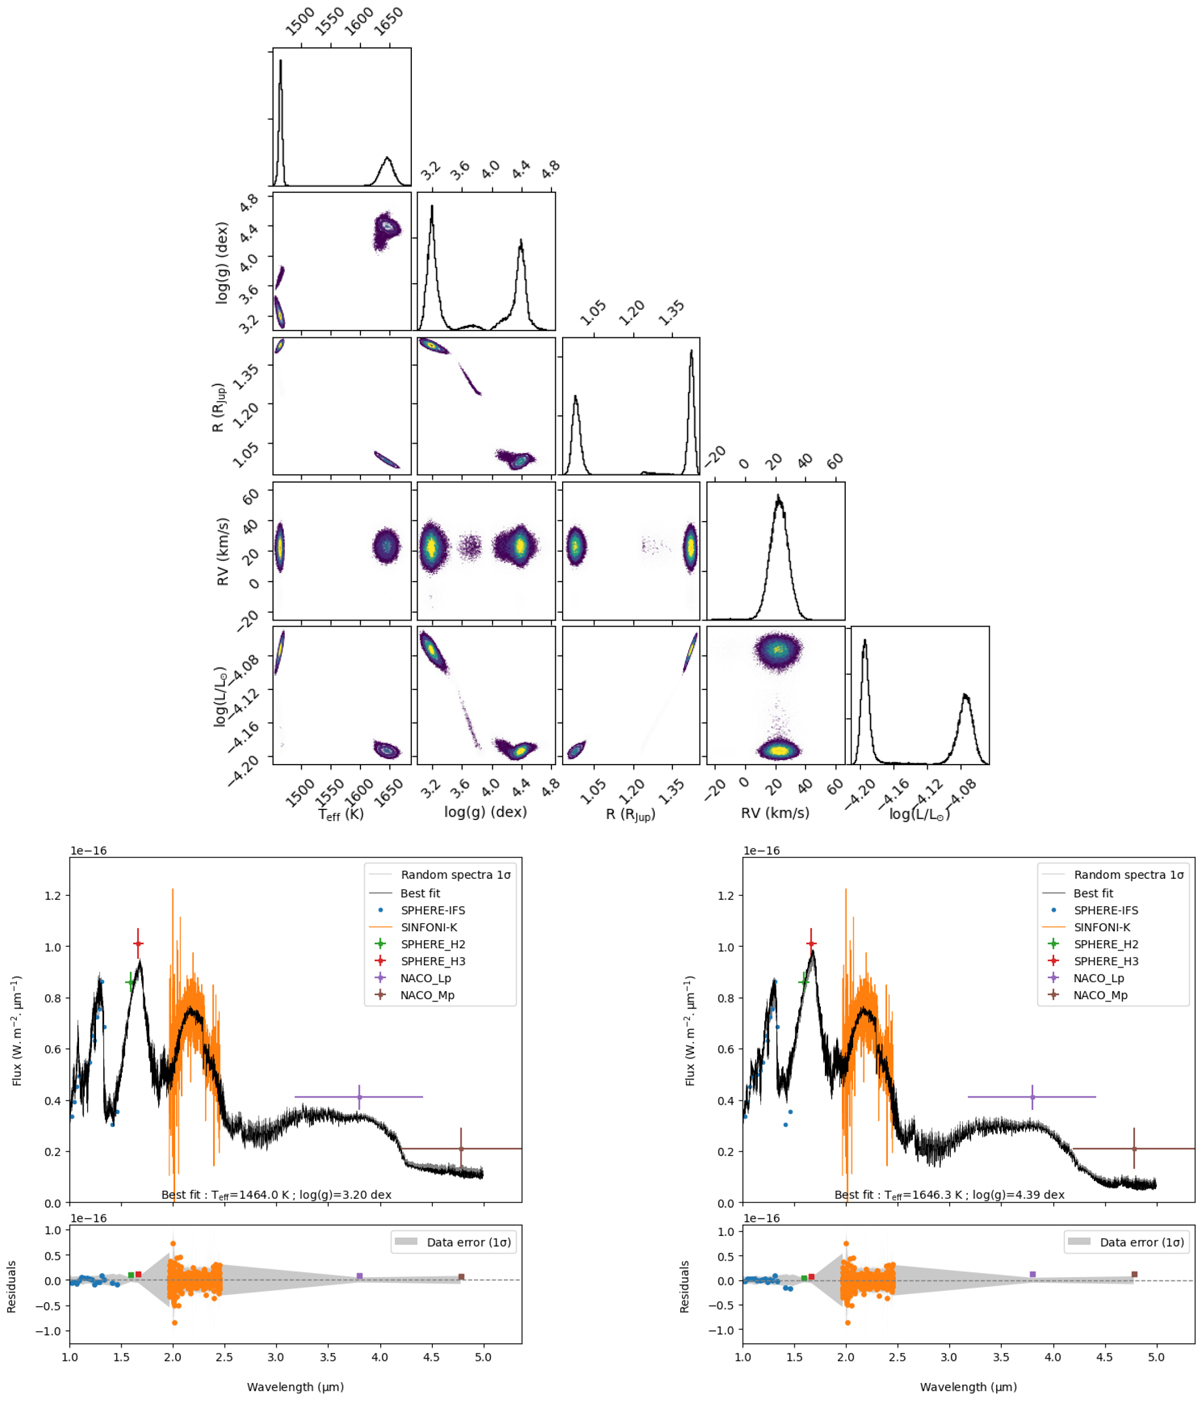
Application of ForMoSA using the BT-SETTL15 models. Top: bimodal posterior distribution. Bottom left and right: comparison of the best fit and the observed data for the low Teff and high Teff modes. The data points were obtained using the low-resolution SPHERE-IFS spectrum (R ≃ 30–50; blue points, Chauvin et al. 2017), the SPHERE-IRDIS H-band photometry (green and red points; Cheetham et al. 2019), our medium-resolution SINFONI spectrum (R ≃ 5500); orange points, this work), and the NaCo L’ and M’-band photometry (purple and brown points, respectively; Cheetham et al. 2019). We overlaid 50 synthetic spectra picked randomly within the 1σ envelop of each posterior in gray.
Current usage metrics show cumulative count of Article Views (full-text article views including HTML views, PDF and ePub downloads, according to the available data) and Abstracts Views on Vision4Press platform.
Data correspond to usage on the plateform after 2015. The current usage metrics is available 48-96 hours after online publication and is updated daily on week days.
Initial download of the metrics may take a while.