Fig. C.1
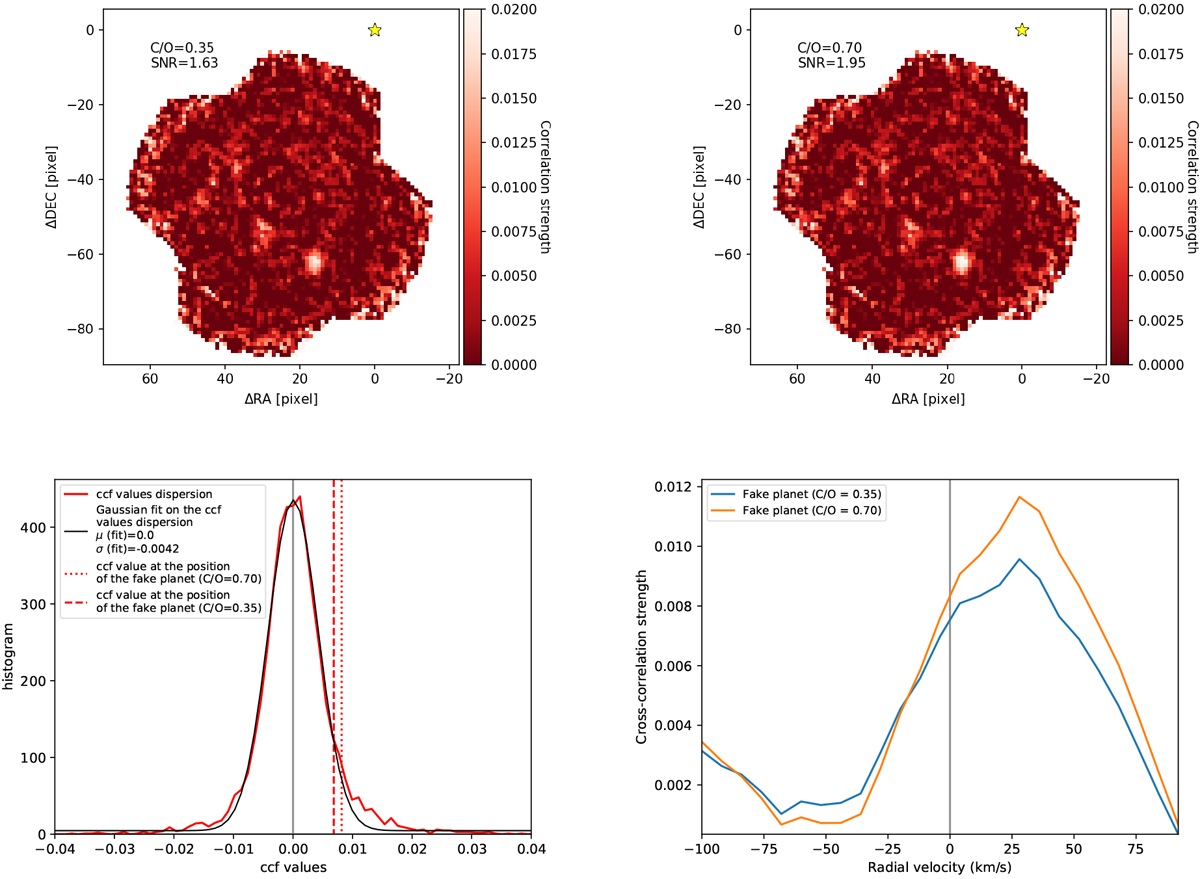
Investigations of the detection performances using the molecular mapping. Upper left and right: CO molecular maps obtained following the injection of a simulated planet at ρ = 812 mas and PA = 165.2° in the original datacubes using Exo-REM models at Teff = 1650 K, log(g) = 4.0 dex, [M/H] = 0.0,and C/O = 0.35 and 0.70 at a velocity of 30 km s−1. Bottom left: histograms of CCF values at a velocity of 30 km s−1. Bottom right: CCF obtained at the position of the simulated planet.
Current usage metrics show cumulative count of Article Views (full-text article views including HTML views, PDF and ePub downloads, according to the available data) and Abstracts Views on Vision4Press platform.
Data correspond to usage on the plateform after 2015. The current usage metrics is available 48-96 hours after online publication and is updated daily on week days.
Initial download of the metrics may take a while.