Fig. B.1
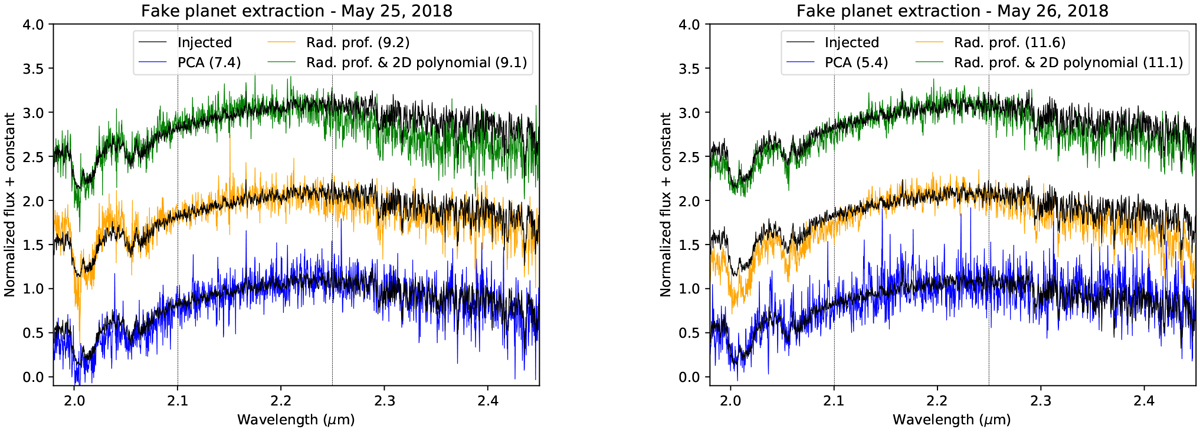
Comparison of the injected (black lines) and extracted simulated planet spectra (color lines) using the methods described in Sect. 2: PCA (blue), the removal of a circular profile at each wavelength (orange), and the removal of a 2D polynomial at each wavelength at the position of the simulated planet (green). The S/N of the recovered spectra is computed from 2.1 to 2.25 μm (dashed vertical lines) and given in parentheses.
Current usage metrics show cumulative count of Article Views (full-text article views including HTML views, PDF and ePub downloads, according to the available data) and Abstracts Views on Vision4Press platform.
Data correspond to usage on the plateform after 2015. The current usage metrics is available 48-96 hours after online publication and is updated daily on week days.
Initial download of the metrics may take a while.