Fig. 10
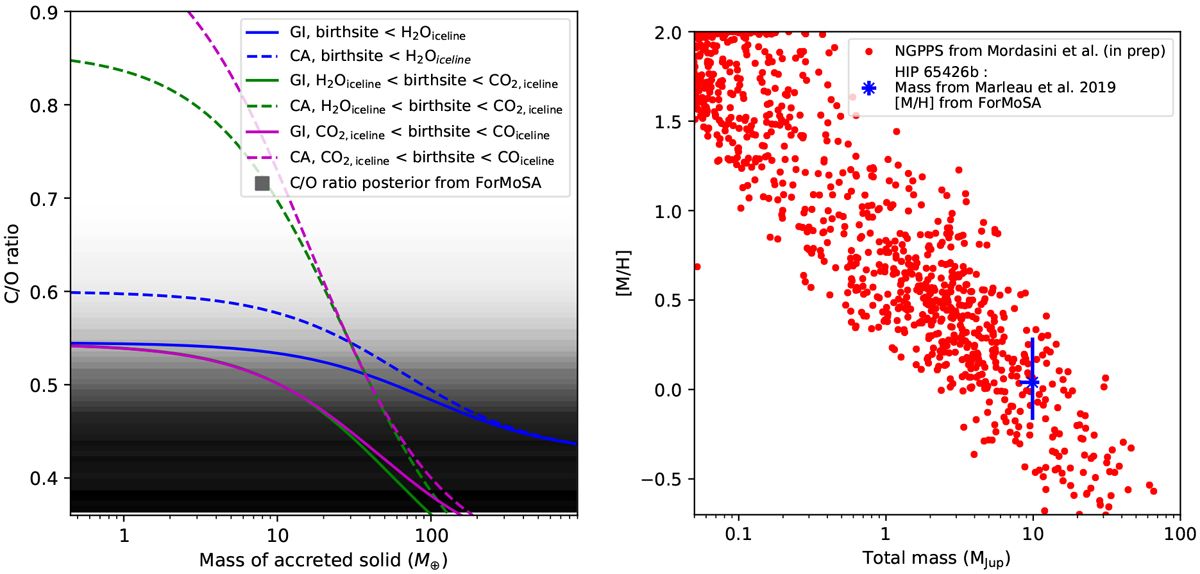
Exploitation of our C/O and [M/H] to constrain the formation pathway. Left: comparison of the posterior of the C/O ratio given by ForMoSA (gradient; black: high likelihood) and different scenario of formation as a function of the accreted solid mass. The solid lines correspond to the GI scenario, and the dashed lines correspond to the CA scenario. The blue, green, and purple curves represent a formation within the water-ice line, between the water and CO2 ice lines, andbetween CO2 and CO ice lines, respectively. Right: comparison of the bulk enrichment of the NGPPS (red dots) and the estimated properties of HIP 65426 b (blue dot). We show here the NGPPS with a mass higher than 0.05 MJup (approximately the mass of Neptune).
Current usage metrics show cumulative count of Article Views (full-text article views including HTML views, PDF and ePub downloads, according to the available data) and Abstracts Views on Vision4Press platform.
Data correspond to usage on the plateform after 2015. The current usage metrics is available 48-96 hours after online publication and is updated daily on week days.
Initial download of the metrics may take a while.