| Issue |
A&A
Volume 646, February 2021
|
|
|---|---|---|
| Article Number | A102 | |
| Number of page(s) | 10 | |
| Section | Interstellar and circumstellar matter | |
| DOI | https://doi.org/10.1051/0004-6361/202039370 | |
| Published online | 15 February 2021 | |
Viscous heating in the disk of the outbursting star FU Orionis★
1
University of Exeter, School of Physics and Astronomy, Astrophysics Group,
Stocker Road,
Exeter,
EX4 4QL, UK
e-mail: This email address is being protected from spambots. You need JavaScript enabled to view it.
2
University of Michigan, Department of Astronomy, S University Ave,
Ann Arbor,
MI
48109, USA
3
Institut de Planetologie et d’Astronomie de Grenoble,
Grenoble
38058, France
4
Steward Observatory, Department of Astronomy, University of Arizona,
Tuscon, USA
5
The CHARA Array of Georgia State University, Mount Wilson Observatory,
Mount Wilson,
CA
91023, USA
6
Instituut voor Sterrenkunde,
KU Leuven, Celestijnenlaan 200D,
3001
Leuven, Belgium
Received:
8
September
2020
Accepted:
14
November
2020
Abstract
Context. FU Orionis is the archetypal FUor star, a subclass of young stellar objects (YSOs) that undergo rapid brightening events, often gaining between four and six magnitudes on timescales of days. This brightening is often associated with a massive increase in accretion, which is one of the most ubiquitous processes in astrophysics for bodies ranging from planets and stars to super-massive black holes. We present multi-band interferometric observations of the FU Ori circumstellar environment, including the first J-band interferometric observations of a YSO.
Aims. We investigate the morphology and temperature gradient of the innermost regions of the accretion disk around FU Orionis. We aim to characterise the heating mechanisms of the disk and comment on potential outburst-triggering processes.
Methods. Recent upgrades to the MIRC-X instrument at the CHARA array have allowed for the first dual-band J and H observations of YSOs. Using baselines up to 331 m, we present high-angular-resolution data of a YSO covering the near-infrared bands J, H, and K. The unprecedented spectral range of the data allowed us to apply temperature gradient models to the innermost regions of FU Ori.
Results. We spatially resolved the innermost astronomical unit of the disk and determine the exponent of the temperature gradient of the inner disk to T ∝ r−0.74 ± 0.02. This agrees with theoretical works that predict T ∝ r−0.75 for actively accreting, steady-state disks, which is a value only obtainable through viscous heating within the disk. We found a disk that extends down to the stellar surface at 0.015 ± 0.007 au, where the temperature is found to be 5800 ± 700 K. We found a disk inclined at 32 ± 4° with a minor-axis position angle of 34 ± 11°.
Conclusions. We demonstrate that J-band interferometric observations of YSOs are feasible with the MIRC-X instrument at CHARA. The temperature gradient power-law derived for the inner disk is consistent with theoretical predictions for steady-state, optically thick, viciously heated accretion disks.
Key words: techniques: interferometric / accretion, accretion disks / protoplanetary disks
Reduced data are only available at the CDS via anonymous ftp to cdsarc.u-strasbg.fr (130.79.128.5) or via http://cdsarc.u-strasbg.fr/viz-bin/cat/J/A+A/646/A102
© ESO 2021
1 Introduction
Accretion onto astronomical objects is one of the most fundamental processes in astrophysics, facilitating mass transport onto a wide range of astrophysical objects, ranging from planets and stars to super-massive black holes (Lin & Papaloizou 1996). The mass transport proceeds through accretion disks, where viscosity converts angular momentum into thermal energy, thus enabling the mass infall (Pringle & Rees 1972). A key prediction is that the disk viscosity should actively heat the disk, where the radial temperature profile was predicted as far back as the 1970s (Shakura & Sunyaev 1973; Shibazaki & Hōshi 1975; Hartmann & Kenyon 1985).
The radial temperature gradient of circumstellar disks are determined by the heating mechanisms that power them. The two primary heating mechanisms in protoplanetary disks are the reprocessing of stellar radiation and viscous heating (D’Alessio et al. 2005). Stellar radiation is reprocessed through absorption, re-emission, and scattering of photons and is most effective in the outer layers of the disk owing to the optical depth of material (Natta et al. 2001). Viscous heating, on the other hand, is thought to be confined to the mid-plane, where it is likely driven by turbulence and instabilities in the disk material, such as magneto-rotation instabilities (Balbus & Hawley 1998). However, the presence and nature of viscosity is highly debated and relatively unconstrained by the current observational data.
The appreciation of accretion and viscousity processes in young stellar objects (YSOs) is vital to the understanding of both star- and planet-formation mechanisms. Active accretion disks have been observed around a wide range of YSO classes. However, YSOs are known to be 10–100 times less luminous than expected from steady-state accretion scenarios, particularly given that the accretion rates observed around many YSOs are on the order of 10−7 to 10−8 M⊙ yr−1. This raises the possibility that accretion is not consistent across the early states of stellar evolution, but, rather, it is episodic (Kenyon & Hartmann 1995; Evans et al. 2009). Such scenarios may be manifested in outbursting events.
Many stars are known to undergo episodic accretion events and FU Orionis (FUor) stars are the best-known examples of such stars. Such FUors are characterised by rapid brightening events (Audard et al. 2014) followed by a protracted period of dimming on the order of decades to centuries to return to the quiescence state (Hartmann & Kenyon 1996; Herbig 2007; Kraus et al. 2016). In such an outburst the accretion rates can increase to ~ 10−4 M⊙ yr−1. It is now thought that most YSOs stars exhibit episodic accretion, undergoing at least one or more outburst events throughout their lifetime (Hartmann & Kenyon 1996; Audard et al. 2014).
The triggering mechanism of outbursts in FUor-type stars is not well understood. Various scenarios have been proposed to explain the massive increase in the accretion rate seen in these objects. Vorobyov & Basu (2005, 2006) propose gravitational instabilities on large scales cause the disk to fragment, which leads to clumps of material falling onto the central star. Bell & Lin (1994) suggest that a thermal instability in the very inner regions (<0.1 au) could be sufficient to cause outbursts of this magnitude. Bonnell & Bastien (1992) propose that a binary companion on a highly eccentric orbit could perturb the disk and cause repeated outburst of accretion. Similarly, Reipurth & Aspin (2004) suggest that FUor stars are newly created binary systems, where the two stars become bound following the breakup of larger multiple systems. Such a scenario leads to the ejection of companions and the rapid infall of material. However, given the limited number of known FUors, there is little consensus on what causes the FUor outburst triggering mechanism.
FU Orionis (FU Ori) is the archetypal FUor object located in the Lambda-Orion star-forming region at a distance of 416 ± 8 pc (Bailer-Jones et al. 2018). The full stellar parameters are listed in Table 1. FU Ori is known to be a binary system with an actively accreting companion located 0.5″ to the south. Despite being ~4 mag fainter (in the V band), FU Ori S is thought to be the more massive object (1.2 M⊙) (Beck & Aspin 2012). Meanwhile, the mass of the northern component has been estimated to be 0.3 ± 0.1 M⊙ based on modelling of the spectral energy distribution (SED) by Zhu et al. (2007). In 1937, FU Ori N underwent a rapid brightening event whereby its brightness increased from 15.5m ± 0.5 to 9.7m ± 0.1 (Clarke et al. 2005) in the photographic system (similar spectral response to Johnson B filter). Since reaching a peak shortly after outburst, its magnitude has decreased steadily at around 0.0125m per year in the B band (540 nm).
FU Ori is one of the best-studied YSOs due to its high magnitude and unique nature. Scattered light observations by Takami et al. (2014) and Laws et al. (2020) with Subaru and GPI, respectively, reveal a large spiral arm structure in the north-west of the disk extending around 200 au that has been attributed to a gravitational instability in the outer disk. Additionally, they reveal a stripe or shadow in the northern disk and a diffuse outflow extending to the east, which is tentatively attributed to a jet in polar direction. Eisner & Hillenbrand (2011) observed FU Ori using the Keck interferometer in the high-resolution K band mode (λ = 2.15−2.36, R = 2000). They found a temperature gradient of T ∝ R−0.95 for the inner disk using a single baseline. Additionally, Liu et al. (2019) presented medium resolution GRAVITY observations (λ = 2.0−2.45, R = 500), which they model as an off-centre face-on Gaussian object. They also highlight H2 O and CO absorption features that are consistent with a Ṁ ~ 10−4 M⊙ yr−1 accretion disk model. The ALMA observations taken by Pérez et al. (2020) show a disk inclined at ~ 37° at a position angle of 134 ± 2°, with both values aligned to a disk detection around the southern component. Using methods outlined by Zhu et al. (2007), Pérez et al. (2020) were able to constrain the stellar parameters of the northern component based on the disk geometry. They found a stellar mass of 0.6 M⊙, with a mass accretion rate of 3.8 × 10⁻⁵ Ṁ yr−1. They went further to derive an inner disk radius of 3.5 R⊙ or 0.016 au. Mid-infrared (MIR) interferometry in the N band and the SED analysis by Quanz et al. (2006) have given a temperature gradient for the outer disk of > 3 au, which is in good agreement with what can be found for isothermal flared disks in theoretical works (Kenyon & Hartmann 1987).
In non-outbursting, low-mass YSOs (namely, T Tauri stars) the mass infall is believed to proceed through magnetospheric accretion columns operating between the inner disk and the photosphere (Bouvier et al. 2007). It is not yet understood how the accretion geometry differs in highly accreting FUors, which also limits our understanding of the outburst-triggering mechanisms. In order to further our understanding of these processes, we conducted the first tri-waveband NIR interferometric study of a YSO at the CHARA array using MIRC-X in the J and H bands. These include simultaneous J- and H-band observationsusing MIRC-X that are the first of their kind. This data are complemented with observations in the K band from the CLassic Interferometry with Multiple Baselines (CLIMB) beam combiner. The observations are introduced in Sect. 2. Our modelling techniques and temperature gradient analysis are shown in Sect. 3.3. The details of our companion search are outlined in Sect. 3.4 and we discuss the implications and draw conclusions in Sects. 4 and 5, respectively.
2 Observations
To collect the data for this multi-wavelength study, a variety of instruments operating at a range of wavelengths were employed. A summary of the observations is provided in Table 2 and the resulting UV coverage is shown in Fig. 1.
2.1 CHARA/MIRC-X H-band observations
The primary instrument used in this study is the Michigan InfraRed Combiner-eXeter (MIRC-X), which is a six-telescope beam combiner instrument located at the CHARA array. The CHARA array is a Y-shaped interferometric facility that comprises six 1 m telescopes. It is located at the Mount Wilson Observatory, California, and offers operational baselines between 34 and 331 m (ten Brummelaar et al. 2005). The MIRC-X instrument (Monnier et al. 2004; Kraus et al. 2018; Anugu et al. 2020) is recording data routinely in the H-band (λ = 1.63 μm, 94λ = 0.35 μm with R = λ∕94λ = 50) since late 2017 (first results in Kraus et al. 2020).
Overall we obtained four independent H-band pointings of FU Ori with MIRC-X, using a mixture of five- and six-telescope configurations in bracketed calibrator-science concatenation sequences. A maximum physical baseline of 331 m was used, corresponding to a maximum resolution of λ∕(2B) = 0.50 mas [milliarcseconds], where λ is the observing wavelength and B is the projected baseline.
The data were reduced using the MIRC-X data reduction pipeline v1.2.01 to produce calibrated squared visibilites and closure phases. The MIRC-X detector is susceptible to bias in the bispectrum estimation, as pointed out by Basden & Haniff (2004). The pipeline corrects for this with a method similar to Appendix C of that paper. The measured visibilities and closure phases were calibrated using interferometric calibrator stars observed alongside the target; the calibrators are listed in Table 2 and their diameters are given in Appendix A. The adopted uniform diameters (UDs) were obtained from JMMC SearchCal (Bonneau et al. 2006, 2011).
Observing log of all instruments and data spanning 10 yr from 1998 to 2019.
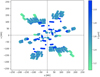 |
Fig. 1 UV plane of all observations detailed in Table 2. The H+J dual-band observations were obtained with CHARA/MIRC-X. The H-band-only observationswere obtained with CHARA/MIRC-X with R = 50 spectral resolution and with VLTI/PIONIER in free mode, while the K-band observationswere obtained with CHARA/CLIMB and PTI. |
2.2 CHARA/MIRC-X J+H band observations
Recent developments have allowed the wavelength of MIRC-X to be extended to allow for simultaneous H and J-band observationsthrough the implementation of longitudinal dispersion compensators (LDCs) to correct for atmospheric dispersion between the two bands (Berger et al. 2003). LDCs consist of a wedge of SF-10 glass which is moved across the beam to increase or decrease the thickness of glass depending on the total airpath of the interferometric system. At the time, the LDCs were tracked manually resulting in sub-optimal fringe contrast in the J band, however a consistent approach was used across calibrator and science stars to ensure accurate calibration could be obtained. Such observationswere conducted for the first time in November 2019, with automated LDC control now in the late stage of development (Anugu et al. 2020).
The data presented in this paper represents the first successful J-band interferometric observations of a YSO. These dual-band observations correspond to 14 spectral channels across wavelengths 1.08 to 1.27 μm and 1.41 to 1.73 μm. The gap in the band pass is due to the presence of the CHARA metrology laser at around 1.3 μm, this was removed using a narrow-band “notch” filter.
We obtained two J+H band pointings on FU Ori with MIRC-X in 2019, using a four-telescope configuration in CAL-SCI concatenation sequences. Only a four-telescope configuration corresponding to the lowest spatial frequency fringes can be used for dual-band observations. Recording with five or six telescopes would result in the highest spatial frequency being undersampled (sub-Nyquist) on the detector. Of the available baselines, a maximum physical baseline of 280 m was used corresponding to a maximum resolution of 0.34 mas.
These data were reduced using an adapted version of the MIRC-X data-reduction pipeline v1.2.0. The UDs of the calibrator stars were obtained from JMMC SearchCal (Bonneau et al. 2006, 2011). The spectral dependence of the UDs between the J and H bands is small enough to be considered negligible by the calibration pipeline.
2.3 VLT/PIONIER H-band observations
FU Ori wasrecorded with the PIONIER instrument by Le Bouquin et al. (2011), which is a four-telescope beam combiner operating in the H band (λ = 1.64 μm) at the Very Large Telescope Interferometer (VLTI). The data were obtained in December 2017 without a dispersive element (FREE mode) and reduced using the standard PIONIER data reduction software (PNDRS; Le Bouquin et al. 2011).
2.4 VLTI/CLIMB K-band observations
We present observations obtained with the CLIMB instrument (ten Brummelaar et al. 2013), also located at the CHARA array. CLIMB is a three-telescope beam combiner that was used to obtain near-infrared K-band data (λ = 2.13 μm, 94λ = 0.35 μm) between November 2009 and October 2011. The CLIMB data were reduced using pipelines developed at the University of Michigan that are optimised for recovering faint fringes from low-visibility data.
Archival K-band data were also available from the Palomar Testbed Interferometer (PTI, Colavita et al. 1999) from 1998 to 2008 using a two-telescope beam combiner on three different physical baselines between 86 and 110 m. The data on FU Ori was published in Malbet et al. (1998, 2005). These additional measurements complement the CHARA observations in the short-to-intermediate baseline range; the full UV coverage is shown in Fig. 1.
2.5 Photometric observations
Photometric observations were collected from a variety of sources in order to build up the SED of FU Ori. Where possible, care was taken to minimize the time difference between observations and the number of instruments used. In particular, photometric data taken during the 1998 to 2019 period of the interferometric observations was considered whenever possible. A full list of the applied photometric observations can be seen in Appendix B.
3 Modelling and results
3.1 Presentation of results
The closure phases and squared visibilities obtained for all instruments are shown in Figs. 2 and 3, respectively. The visibilities are split into position angle bins of 20° and coloured according to wavelength.
The majority of our observations are contained within the MIRC-X, PIONIER, and GRAVITY data, which were taken over the relatively short period of three years. Hence, the effect of photometric variability in the NIR of the object is thought to be minimal. On the other hand, the CLIMB and PTI observations were taken over a significantly longer timescale, over which a small amount of photometric variability may be expected. Based on the established decreasing trend in the magnitude of 0.0125 per year in the B band, the expected drop change in the visibility based on the changing stellar-to-disk flux ratio between 1998 and 2019 is 0.045. However, we are confident that the large error bars caused by the poor signal-to-noise of these observations is expected to successfully account for variability on the visibility and closure phase measurements. Even so, care was taken to check for time dependencies in the visibilities of baselines of similar length and position angle. The K-band squared visibilities were binned according to the year of the observation and compared with each other. Each night of H-band data were compared separately to other nights.While J-band data from MIRC-X could not be compared directly, the H-band data taken simultaneously could be compared with other nights. None of these checks revealed any time variability in the data beyond the noise level, hence, all interferometric data can be studied together. Also, we fitted our model to the post-2009 interferometric data alone and obtained values that are consistent on the 1.3σ-level with those obtained from fitting the complete data. This confirms that any potential temporal variability does not affect our results significantly.
The closure phases (Fig. 2) are consistent with 0° within the error bars, indicating a centro-symmetric brightness distribution. The reduced chi-square for the closure phase measurements ( , see definition in Kraus et al. 2009) for a centro-symmetric model (i.e. with closure phases of 0° along all triangles) is 3.65.
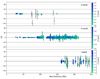 |
Fig. 2 Closure phases for each waveband plotted against maximum baseline length, coloured according to observing wavelength. Shorter wavelengths in each band correspond to lighter green colours while longer wavelengths in each band are represented as dark blue. |
3.2 Simple geometric models
As a first step for interpreting the recorded interferometric observables, we fitted simple geometric models to the data. This allows for the characteristic size, inclination, and position angle of the object we aim to derive. We employed a Gaussian model within the Radiative transfer and Analytic modelling Pipeline for Interferometric Disk Observations (RAPIDO) framework, which utilises the Markov chain Monte Carlo (MCMC) sampler emcee (Foreman-Mackey et al. 2013) to produce a fit and error estimate. The Gaussian model employed is a “grey” model in that it contains no spectral information. As such, the three wavebands of our observations were fitted separately. In addition to a Gaussian model, a secondary unresolved, extended component was also required. The free parameters of the model were the full-width-half-maximum (FWHM) of the Gaussian, the inclination (INC), minor axis position angle (PA), and the flux of the unresolved, extended component (Fbg), which is measured as a percentage of the total flux in the model.
Table 3 summarises the results of the Gaussian fitting. The inclination (~ 37°) and position angle (~40°) of the object are consistent across all three wavebands as expected. The size of the disk as characterised by the FWHM of the Gaussian shows an increase in size with increasing wavelength from 0.38 mas in the J band to 0.60 mas in the K band. This is expected given that longer wavelengths probe cooler regions of the disk, which are found at a greater distance from the central star. The flux contained within the extended component also shows a spectral dependency with a lower flux contrast at shorter wavelengths of only 2.5% in the J band, compared to8.6% in the K band.
A Gaussian model is intrinsically centro-symmetric and, as such, it has a closure phase of 0° across all triangles. This is a very good approximation to the observations, whereby very small closure phase signals are measured. A reduced  value for the closure phases of 3.65 was calculated for a Gaussian model fitted to all data.
Best-fit parameters for the Gaussian models to each of the three wav-bands, independently.
3.3 Disk temperature structure and geometry
The primary limitation of the Gaussian models employed is the lack of spectral information within the intrinsically “grey” model. As our interferometric data covers three wavebands, it is vital to account for the spectral dependency, as each wavelength channel probes a different temperature regime and, hence, a different disk radius.
A temperature gradient model (TGM) allows for the simultaneous fitting of interferometric and photometric observables. It is built up by several rings extending from an inner radius, Rin, to an outer radius, Rout. Each ring is associated with temperature and, hence, flux. Therefore, a model SED can be computed by integrating over the resulting blackbody distributions for each of the concentric rings. Such a model allows us to not only to build up a picture of the temperature profile, but also to approximate the position of the inner radius. The TGM is based upon 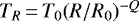 , where T0 is the temperature at the inner radius of the disk, R0, and Q is the exponent of the temperature gradient (Kreplin et al. 2020; Eisner & Hillenbrand 2011). A TGM represents an intrinsically geometrically thin disk. A point source is used at the centre of each model to represent an unresolved star, which is a reasonable approximation given the expected diameter of the star of 4.3 R⊙ resulting in an angular diameter of 0.05 mas (Pérez et al. 2020).
In the previous section, we present our efforts to reliably constrain the inclination and position angle of the disk for the first time. Our geometric modelling found an inclination of 32 ± 4° and a minor axis position angle of 34 ± 11° measured tothe east from the north. These values were fixed in the fitting of temperature gradient model in order to reduce the number of free parameters. The fitting was undertaken using all the visibility data, shown in Fig. 3, and with all of the SED shown in Fig. 5, which is constructed from the photometry detailed in Appendix B. Interstellar extinction was taken as E(B−V) = 0.48 (AV = 1.4), as describedby Pueyo et al. (2012) and was used to redden the model results during fitting. The SED of FU Ori is unusual in the context of YSOs, in that it is almost completely dominated by disk flux even across the visible, where the central star only contributes 1− 2%. The fitting and error computation is done using the MCMC sampler corner (Foreman-Mackey 2016) to produce corner plots from which parameter degeneracies and errors can be analysed. This is ideal for fitting many parameters simultaneously in a consistent manner (Fig. 4).[23.5pc]
Figure 6 shows the best-fit temperature gradient model which corresponds to an inner disk radius of 0.015 ± 0.007 au with a temperatureof 5800 ± 700 K and an exponent Q = 0.74 ± 0.02. By design, the brightness distribution computed from our model of a geometrically thin disk with a radial temperaturegradient is intrinsically centro-symmetric, meaning all closure phase measurements are equivalent to 0°.
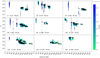 |
Fig. 3 Squared visibilities plotted against spatial frequency, split by baseline position angle into 20° bins. The blue/green crosses represent the interferometric observations across all instruments, coloured according to observing wavelength: dark blue is K-band data, light blue is H-band, and green is J-band data. The black circles are the model visibilities of the best-fit temperature-gradient model corresponding to each data point. |
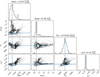 |
Fig. 4 Posterior distributions of the parameters of the Temperature Gradient Model, produced using the corner package (Foreman-Mackey 2016). The position angle and inclination of the disk are fixed by to those obtained through Gaussian modelling. |
Best-fit parameters of the temperature gradient model.
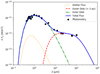 |
Fig. 5 SED of FU Ori. The data in black represents the photometry points compiled in Apppendix B. The yellow dotted line indicates the stellar flux contribution, the red dashed line the outer (> 3 au disk as determined by Quanz et al. 2006). The green dashed-dotted line represents the contribution from the inner disk, described here as a temperature gradient model. The blue line is the total flux, a sum of all components. |
3.4 Companion constraints
In addition to disk modelling, we undertook a companion search to search for a putative, previously undetected companions within the field of view of our observations. FU Ori is a known binary system, however the southern component, located at a separation of 0.5″, is outside the field of view of all interferometric observations. The companion search was undertaken using the RAPIDO model-fitting code and a companion finder extension described in Davies et al. (2018). This module computes a grid of model, where a point source is added to the best-fit model described in Sect. 3.3. The resulting  detection significance map allows us to estimate the detection significance or to derive an upper detection limit if no significant companion is detected.
A companion search was undertaken separately on the two epochs of MIRC-X H-band data obtained in November 2018 and November 2019. It was only these dates that were chosen as they offer good UV coverage over the shortest possible time period (one night), making it an ideal basis for conducting companion searches. On the other hand, the supplementary data (MIRC-X J-band data, CLIMB K-band data, and PIONIER H-band data) is taken over many years and on fewer baselines, so individual epochs contain sparse UV coverage.
In order for a detection to be considered significant, the p-value must be greater than5σ. This search finds that the non-zero flux solution for a companion is not significant with a p-value of 3.04. Following the non-detection, the upper limits to the flux of any companion can be calculated for each (x, y) positions in the field-of-view (grid search process described in Davies et al. 2018). The maximum flux contribution from any companion that could remain undetected by our observations is 1.3% of FU Ori’s total flux in H-band within 0.5 to 50 mas. Assuming a mass luminosity relation of L ∝ M4, this flux contrast corresponds to a maximum companion mass of 0.12 M⊙.
4 Discussion
In this work, we present the first J-band interferometric observations of a young stellar object, thus demonstrating the feasibility of such observations, particularly in the context of multi-waveband interferometry. The J-band has been a relatively untapped resource in interferometry and the feasibility of these observations is of great interest to the wider scientific community. The J-band has the potential to not only be used in YSO studies to examine the sublimation rims and the potential for optically thick gas inside the sublimation radius, but also in stellar photosphere studies, as a waveband which is relatively free from molecular opacities.
By investigating the circumstellar environment of FU Ori, we explored the morphology and temperature gradient of the inner disk and greatly improved the constraints on the parameters of both the star and the disk. Geometric modelling finds a disk inclined at 32 ± 4° with a minor axis position angle of 34 ± 11°. This inclination estimate is significantly more face-on than earlier estimates of 50° and 60° that were based on a variety of techniques, including SED analysis and near/mid-IR interferometry (Malbet et al. 2005; Zhu et al. 2008; Quanz et al. 2006). An inclination of 20−60° based on the CO line-width was derived by Calvet et al. (1991), while Liu et al. (2019) found FU Ori to be face-on based on NIR closure phases with GRAVITY. However, previous interferometric studies were based on very limited UV coverage consisting solely of baselines below 100 m and at a single wavelength, making these estimates less accurate compared to our comprehensive UV coverage. The limitations in UV coverage of earlier interferometric studies likely also resulted in the wide spread of minor axis position angle estimates, ranging from 19° ± 12 (Quanz et al. 2006),  (Malbet et al. 2005). In addition, many literature values are at odds with the tentative detection of a jet or outflow detected on larger scalesby Takami et al. (2018) and Laws et al. (2020) (features C and D, respectively). The putative jet or outflow feature was detected in scattered light imagery obtained with Subaru and GPI, respectively. Assuming the minor disk axis is aligned with the stellar polar axis and, hence, the jet position angle, a position angle of ~ − 25° would be expected. Compared to 34 ± 11° measured here, we find a discrepancy of almost 60°. We see no evidence of such a jet in our continuum imaging on smaller scales.
Temperature gradient models were used in order to fit the spectral dependency of the data. These models allow for the simultaneous fitting of the interferometric data and the SED. The application of these models derives a disk that extends down to the stellar surface at 0.015 ± 0.007 au, where the temperatureof disk is 5800 ± 700 K. This is expected of an object that is actively accreting with such a high rate of 10−4 M⊙ yr−1, and it is also consistent with estimates by Zhu et al. (2007, 2008) where the disk temperature peaks at around 6000 K. An inner disk radius equivalent to that of the star indicates accretion directly from the disk onto the central star. Beyond the inner radius, the temperature falls off with the power law, T ∝r−0.74 ± 0.02, to an outer radius cut-off at 0.76 ± 0.35 au. The determined power-law index is consistent with the predicted temperature profile for a steady-state, optically-thick accretion disk (Pringle 1981). A temperature gradient of this profile is only possible if viscous heating processes are present in the inner disk. The heating of flared disks by reprocessed stellar radiation alone is shown to produce temperature exponents of q < = 0.5 (Kenyon & Hartmann 1987; Dullemond & Dominik 2004). Only through viscous heating can the observed temperature profile be replicated.
The derived inner disk temperature gradient is in agreement with MIR work conducted with the MIDI instrument by Quanz et al. (2006), who also found a value of Q = 0.75 for the innerdisk, although it is unclear whether their estimate was constrained mainly by interferometry or SED data. This is in contrast to the outer (>3 au) disk model they derive, which is also adopted here. In order to successfully fit the long wavelength SED and N-band MIDI interferometry, a temperature gradient of T ∝ r−0.53 is adopted, which is in good agreement with what can be found for isothermal flared disks (Kenyon & Hartmann 1987). In order to test this result, more comprehensive MIR N-band observations with the MATISSE instrument (Lopez et al. 2014) at the VLTI are required.
It has been proposed that FUor stars may be newborn binaries that have become bound when a small non-hierarchical multiple system breaks up (Bonnell & Bastien 1992). In such a scenario, Reipurth & Aspin (2004) predict a close companion (< 10 au). Accordingly, for the FU Ori systems, such models would predict a third component orbiting FU Ori N in the inner 20 mas. Malbet et al. (1998) found tentative evidence for a companion located at ~ 1 au (2.4 mas), however, by the same measure, their data can be interpreted as a circumstellar disk, which was confirmed in later work. No other studies have had detected a companion in the inner few astronomical units around FU Ori N. We conducted a companion search based on our MIRC-X H-band visibilities and closure phases and we derived an upper limit to the flux contrast of 1.3%, which corresponds to a maximum companion mass of 0.12 M⊙ in the separation range between 0.5 and 50.0 mas. Therefore, our observations do not support the scenario involving the newborn binaries cited above.
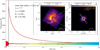 |
Fig. 6 Temperature gradient of FU Ori over the inner disk. The temperature and location of the inner radius of the disk are 5800 K and 0.015 au, respectively. The dashed line represents the inner disk edge. The vertical profile of the disk schematic is not to scale, nor does it represent the vertical temperature structure of the disk. INSET-left: linearly polarized intensity, scattered light image obtained with the Gemini Planet Imager (GPI) in the J-band (Laws et al. 2020). The image is centered on FU Ori N within the black circle. FU Ori S is also visible to the South-West. INSET -right: brightness distribution of the TGM disk model in the J-band, as derived in this work. In both panels, we plot normalised surface brightness with a logarithmic colour scale. The white lines in the image indicate the position angle of the disk minor-axis derived from other observations in literature and in this work. |
5 Conclusions
Our multi-wavelength study has probed the inner disk geometry of FU Ori at the highest angular resolution to date. Furthermore, we put the first tight constraints on the disk temperature structure in the inner astronomical unit.
We summarise our conclusions as follows:
-
We believe this study, which is the first of its kind, demonstrates a powerful and exciting new technique in the study of accretion and circumstellar disks. This allows us to directly test long-posited theoretical works with observational evidenceand provide clues about the true nature of accretion and viscosity processes.
-
Temperature-gradient models find an inner disk that extends down to the stellar photosphere at 0.015 ± 0.007 au, where the temperature reaches 5800 ± 700 K. This is in agreement with a heavily accreting star, such as outbursting FUors, and indicates accretion directly onto the stellar surface.
-
The temperature of the inner disk falls off with a power law of T ∝ r−0.74 ± 0.02. This is consistent with theoretical works on steady-state, optically-thick accretion disks. Such a temperature profile is only possible if viscous heating processes are present in the inner disk.
-
The inclination and position angle of the disk are tightly constrained, providing a significant improvement over the literature values. An inclination of 32 ± 4° and a minor axis position angle of 34 ± 11° are found from geometric modelling.
-
The minor axis position angle is around 60° misaligned with the detection of a jet or outflow detected in scattered light images, assuming that the jet is perpendicular to the disk.
-
No significant companion is detected within the field of view between 0.5 to 50 mas. We placean upper limit of 1.3% of the total H-band flux for a potential companion in this separation range.
Our study demonstrates the potential of combined J- and H-band interferometry to constrain the temperature structure on milliarcsecond scales. This technique is set to enable exciting new studies on a broad range of science applications, ranging from the characterisation of the disks around young stellar objects to stellar surface imaging.
Acknowledgements
We acknowledge support from an STFC studentship (No. 630008203) and an European Research Council Starting Grant (Grant Agreement No. 639889). J.D.M. acknowledges funding from NASA NNX09AB87G, NSF NSF-ATI 1506540, and NASA XRP Grant NNX16AD43G. This research has made use of the VizieR catalogue access tool, CDS, Strasbourg, France. The original description of the VizieR service was published in Ochsenbein et al. (2000). This work is based upon observations obtained with the Georgia State University Center for High Angular Resolution Astronomy Array at Mount Wilson Observatory. The CHARA Array is supported by the National Science Foundation under Grant No. AST-1636624 and AST-1715788. Institutional support has been provided from the GSU College of Arts and Sciences and the GSU Office of the Vice President for Research and Economic Development. MIRC-X received funding from the European Research Council (ERC) under the European Union’s Horizon 2020 research and innovation programme (Grant No. 639889). Based on observations collected at the European Organisation for Astronomical Research in the Southern Hemisphere under ESO programmes 0100.C-0278(J) and 098.C-0765(C)
Appendix A List of calibrators
Calibrators used in the reduction of interferometric data across all instruments.
Appendix B Photometry used in the SED fitting
Photometric data points used in the construction of the SED of FU Ori.
References
- Abrahamyan, H. V., Mickaelian, A. M., & Knyazyan, A. V. 2015, Astron. Comput., 10, 99 [NASA ADS] [CrossRef] [Google Scholar]
- Anugu, N., Le Bouquin, J.-B., Monnier, J. D., et al. 2020, AJ, 160, 158 [Google Scholar]
- Audard, M., Ábrahám, P., Dunham, M. M., et al. 2014, in Protostars and Planets VI, eds. H. Beuther, R. S. Klessen, C. P. Dullemond, & T. Henning (Tucson, AZ: UNiversity of Arizona Press), 387 [Google Scholar]
- Bailer-Jones, C. A. L., Rybizki, J., Fouesneau, M., Mantelet, G., & Andrae, R. 2018, AJ, 156, 58 [NASA ADS] [CrossRef] [Google Scholar]
- Balbus, S. A., & Hawley, J. F. 1998, Rev. Mod. Phys., 70, 1 [Google Scholar]
- Basden, A. G., & Haniff, C. A. 2004, MNRAS, 347, 1187 [NASA ADS] [CrossRef] [Google Scholar]
- Beck, T. L., & Aspin, C. 2012, AJ, 143, 55 [Google Scholar]
- Bell, K. R., & Lin, D. N. C. 1994, ApJ, 427, 987 [NASA ADS] [CrossRef] [Google Scholar]
- Berger, D. H., ten Brummelaar, T. A., Bagnuolo, William G., J., & McAlister, H. A. 2003, SPIE Conf. Ser., 4838, 974 [Google Scholar]
- Bonneau, D., Clausse, J.-M., Delfosse, X., et al. 2006, A&A, 456, 789 [NASA ADS] [CrossRef] [EDP Sciences] [Google Scholar]
- Bonneau, D., Delfosse, X., Mourard, D., et al. 2011, A&A, 535, A53 [NASA ADS] [CrossRef] [EDP Sciences] [Google Scholar]
- Bonnell, I., & Bastien, P. 1992, ApJ, 401, L31 [Google Scholar]
- Bourgés, L., Lafrasse, S., Mella, G., et al. 2014, ASP Conf. Ser., 485, 223 [NASA ADS] [Google Scholar]
- Bouvier, J., Alencar, S. H. P., Harries, T. J., Johns-Krull, C. M., & Romanova, M. M. 2007, Protostars and Planets V, eds. B. Reipurth, D. Jewitt, & K. Keil (Tucson, AZ: University of Arizona Press), 479 [Google Scholar]
- Calvet, N., Hartmann, L., & Kenyon, S. J. 1991, ApJ, 383, 752 [NASA ADS] [CrossRef] [Google Scholar]
- Chambers, K. C., Magnier, E. A., Metcalfe, N., et al. 2016, ArXiv e-prints [arXiv:1612.05560] [Google Scholar]
- Clarke, C., Lodato, G., Melnikov, S. Y., & Ibrahimov, M. A. 2005, MNRAS, 361, 942 [Google Scholar]
- Colavita, M. M., Wallace, J. K., Hines, B. E., et al. 1999, ApJ, 510, 505 [NASA ADS] [CrossRef] [Google Scholar]
- Cutri, R. M., Skrutskie, M. F., van Dyk, S., et al. 2003, VizieR Online Data Catalog: II/246 [Google Scholar]
- Cutri, R. M., Skrutskie, M. F., van Dyk, S., et al. 2014, VizieR Online Data Catalog: II/328 [Google Scholar]
- D’Alessio, P., Calvet, N., & Woolum, D. S. 2005, ASP Conf. Ser., 341, 353 [Google Scholar]
- Davies, C. L., Kraus, S., Harries, T. J., et al. 2018, ApJ, 866, 23 [Google Scholar]
- Dullemond, C. P., & Dominik, C. 2004, A&A, 417, 159 [NASA ADS] [CrossRef] [EDP Sciences] [Google Scholar]
- Eisner, J. A., & Hillenbrand, L. A. 2011, ApJ, 738, 9 [NASA ADS] [CrossRef] [Google Scholar]
- ESA 1997, ESA SP, 1200 [Google Scholar]
- Evans, Neal J., I., Dunham, M. M., Jørgensen, J. K., et al. 2009, ApJS, 181, 321 [NASA ADS] [CrossRef] [Google Scholar]
- Evans, D. W., Riello, M., De Angeli, F., et al. 2018, A&A, 616, A4 [NASA ADS] [CrossRef] [EDP Sciences] [Google Scholar]
- Foreman-Mackey, D. 2016, J. Open Source Softw., 1, 24 [Google Scholar]
- Foreman-Mackey, D., Hogg, D. W., Lang, D., & Goodman, J. 2013, PASP, 125, 306 [Google Scholar]
- Gezari, D. Y., Schmitz, M., Pitts, P. S., & Mead, J. M. 1993, Catalog of Infrared Observations [Google Scholar]
- Hartmann, L., & Kenyon, S. J. 1985, ApJ, 299, 462 [NASA ADS] [CrossRef] [Google Scholar]
- Hartmann, L., & Kenyon, S. J. 1996, ARA&A, 34, 207 [NASA ADS] [CrossRef] [EDP Sciences] [MathSciNet] [Google Scholar]
- Henden, A. A., Levine, S., Terrell, D., & Welch, D. L. 2015, AAS Meeting 225, 336.16 [Google Scholar]
- Herbig, G. H. 2007, AJ, 133, 2679 [Google Scholar]
- Kenyon, S. J.,& Hartmann, L. 1987, ApJ, 323, 714 [NASA ADS] [CrossRef] [Google Scholar]
- Kenyon, S., & Hartmann, L. 1995, ApJ, 101, 117 [Google Scholar]
- Kraus, S., Hofmann, K. H., Malbet, F., et al. 2009, A&A, 508, 787 [NASA ADS] [CrossRef] [EDP Sciences] [Google Scholar]
- Kraus, S., Caratti o Garatti, A., Garcia-Lopez, R., et al. 2016, MNRAS, 462, L61 [NASA ADS] [CrossRef] [Google Scholar]
- Kraus, S., Monnier, J. D., Anugu, N., et al. 2018, SPIE Conf. Ser., 10701, 1070123 [Google Scholar]
- Kraus, S., Kreplin, A., Young, A. K., et al. 2020, Science, 369, 1233 [Google Scholar]
- Kreplin, A., Kraus, S., Tambovtseva, L., Grinin, V., & Hone, E. 2020, MNRAS, 492, 566 [Google Scholar]
- Laws, A. S. E., Harries, T. J., Setterholm, B. R., et al. 2020, ApJ, 888, 7 [Google Scholar]
- Le Bouquin, J. B., Berger, J. P., Lazareff, B., et al. 2011, A&A, 535, A67 [NASA ADS] [CrossRef] [EDP Sciences] [Google Scholar]
- Lin, D. N. C., & Papaloizou, J. C. B. 1996, ARA&A, 34, 703 [NASA ADS] [CrossRef] [Google Scholar]
- Liu, H. B., Mérand, A., Green, J. D., et al. 2019, ApJ, 884, 97 [Google Scholar]
- Lopez, B., Lagarde, S., Jaffe, W., et al. 2014, The Messenger, 157, 5 [NASA ADS] [Google Scholar]
- Malbet, F., Berger, J. P., Colavita, M. M., et al. 1998, ApJ, 507, L149 [NASA ADS] [CrossRef] [EDP Sciences] [Google Scholar]
- Malbet, F., Lachaume, R., Berger, J. P., et al. 2005, A&A, 437, 627 [Google Scholar]
- McDonald, I., Zijlstra, A. A., & Watson, R. A. 2017, MNRAS, 471, 770 [NASA ADS] [CrossRef] [Google Scholar]
- Monnier, J. D., Berger, J.-P., Millan-Gabet, R., & ten Brummelaar, T. A. 2004, Proc. SPIE, 5491, 1370 [Google Scholar]
- Natta, A., Prusti, T., Neri, R., et al. 2001, A&A, 371, 186 [NASA ADS] [CrossRef] [EDP Sciences] [Google Scholar]
- Ochsenbein, F., Bauer, P., & Marcout, J. 2000, A&AS, 143, 23 [NASA ADS] [CrossRef] [EDP Sciences] [Google Scholar]
- Page, M. J., Brindle, C., Talavera, A., et al. 2012, MNRAS, 426, 903 [Google Scholar]
- Pérez, S., Hales, A., Liu, H. B., et al. 2020, ApJ, 889, 59 [CrossRef] [Google Scholar]
- Pringle, J. E. 1981, ARA&A, 19, 137 [NASA ADS] [CrossRef] [Google Scholar]
- Pringle, J. E., & Rees, M. J. 1972, A&A, 21, 1 [NASA ADS] [Google Scholar]
- Pueyo, L., Hillenbrand, L., Vasisht, G., et al. 2012, ApJ, 757, 57 [Google Scholar]
- Quanz, S. P., Henning, T., Bouwman, J., Ratzka, T., & Leinert, C. 2006, ApJ, 648, 472 [NASA ADS] [CrossRef] [Google Scholar]
- Reipurth, B., & Aspin, C. 2004, ApJ, 608, L65 [Google Scholar]
- Saunders, W., Sutherland, W. J., Maddox, S. J., et al. 2000, MNRAS, 317, 55 [NASA ADS] [CrossRef] [Google Scholar]
- Shakura, N. I., & Sunyaev, R. A. 1973, X- and Gamma-Ray Astronomy (Dordrecht: D. Reidel Publishing Company), 55, 155 [NASA ADS] [CrossRef] [Google Scholar]
- Shibazaki, N., & Hōshi, R. 1975, Prog. Theor. Phys., 54, 706 [NASA ADS] [CrossRef] [Google Scholar]
- Takami, M., Hasegawa, Y., Muto, T., et al. 2014, ApJ, 795, 71 [Google Scholar]
- Takami, M., Fu, G., Liu, H. B., et al. 2018, ApJ, 864, 20 [NASA ADS] [CrossRef] [Google Scholar]
- ten Brummelaar, T. A., McAlister, H. A., Ridgway, S. T., et al. 2005, ApJ, 628, 453 [NASA ADS] [CrossRef] [Google Scholar]
- ten Brummelaar, T. A., Sturmann, J., Ridgway, S. T., et al. 2013, J. Astron. Instrum., 2, 1340004 [CrossRef] [Google Scholar]
- Vorobyov, E. I., & Basu, S. 2005, ApJ, 633, L137 [NASA ADS] [CrossRef] [Google Scholar]
- Vorobyov, E. I., & Basu, S. 2006, ApJ, 650, 956 [NASA ADS] [CrossRef] [Google Scholar]
- Zhu, Z., Hartmann, L., Calvet, N., et al. 2007, ApJ, 669, 483 [NASA ADS] [CrossRef] [Google Scholar]
- Zhu, Z., Hartmann, L., Calvet, N., et al. 2008, ApJ, 684, 1281 [NASA ADS] [CrossRef] [Google Scholar]
All Tables
Best-fit parameters for the Gaussian models to each of the three wav-bands, independently.
Calibrators used in the reduction of interferometric data across all instruments.
All Figures
|
Fig. 1 UV plane of all observations detailed in Table 2. The H+J dual-band observations were obtained with CHARA/MIRC-X. The H-band-only observationswere obtained with CHARA/MIRC-X with R = 50 spectral resolution and with VLTI/PIONIER in free mode, while the K-band observationswere obtained with CHARA/CLIMB and PTI. |
| In the text | |
|
Fig. 2 Closure phases for each waveband plotted against maximum baseline length, coloured according to observing wavelength. Shorter wavelengths in each band correspond to lighter green colours while longer wavelengths in each band are represented as dark blue. |
| In the text | |
|
Fig. 3 Squared visibilities plotted against spatial frequency, split by baseline position angle into 20° bins. The blue/green crosses represent the interferometric observations across all instruments, coloured according to observing wavelength: dark blue is K-band data, light blue is H-band, and green is J-band data. The black circles are the model visibilities of the best-fit temperature-gradient model corresponding to each data point. |
| In the text | |
|
Fig. 4 Posterior distributions of the parameters of the Temperature Gradient Model, produced using the corner package (Foreman-Mackey 2016). The position angle and inclination of the disk are fixed by to those obtained through Gaussian modelling. |
| In the text | |
|
Fig. 5 SED of FU Ori. The data in black represents the photometry points compiled in Apppendix B. The yellow dotted line indicates the stellar flux contribution, the red dashed line the outer (> 3 au disk as determined by Quanz et al. 2006). The green dashed-dotted line represents the contribution from the inner disk, described here as a temperature gradient model. The blue line is the total flux, a sum of all components. |
| In the text | |
|
Fig. 6 Temperature gradient of FU Ori over the inner disk. The temperature and location of the inner radius of the disk are 5800 K and 0.015 au, respectively. The dashed line represents the inner disk edge. The vertical profile of the disk schematic is not to scale, nor does it represent the vertical temperature structure of the disk. INSET-left: linearly polarized intensity, scattered light image obtained with the Gemini Planet Imager (GPI) in the J-band (Laws et al. 2020). The image is centered on FU Ori N within the black circle. FU Ori S is also visible to the South-West. INSET -right: brightness distribution of the TGM disk model in the J-band, as derived in this work. In both panels, we plot normalised surface brightness with a logarithmic colour scale. The white lines in the image indicate the position angle of the disk minor-axis derived from other observations in literature and in this work. |
| In the text | |
Current usage metrics show cumulative count of Article Views (full-text article views including HTML views, PDF and ePub downloads, according to the available data) and Abstracts Views on Vision4Press platform.
Data correspond to usage on the plateform after 2015. The current usage metrics is available 48-96 hours after online publication and is updated daily on week days.
Initial download of the metrics may take a while.