Fig. 5
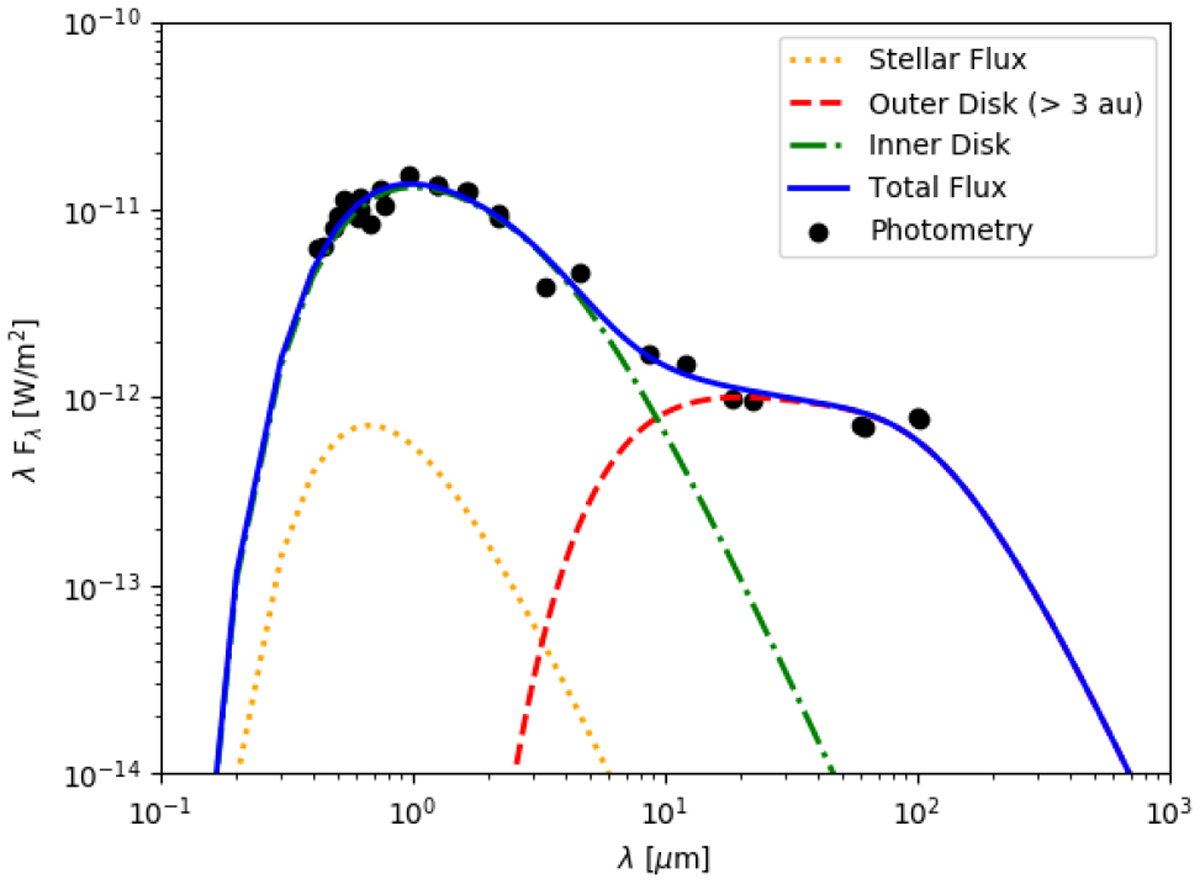
SED of FU Ori. The data in black represents the photometry points compiled in Apppendix B. The yellow dotted line indicates the stellar flux contribution, the red dashed line the outer (> 3 au disk as determined by Quanz et al. 2006). The green dashed-dotted line represents the contribution from the inner disk, described here as a temperature gradient model. The blue line is the total flux, a sum of all components.
Current usage metrics show cumulative count of Article Views (full-text article views including HTML views, PDF and ePub downloads, according to the available data) and Abstracts Views on Vision4Press platform.
Data correspond to usage on the plateform after 2015. The current usage metrics is available 48-96 hours after online publication and is updated daily on week days.
Initial download of the metrics may take a while.