Fig. 3
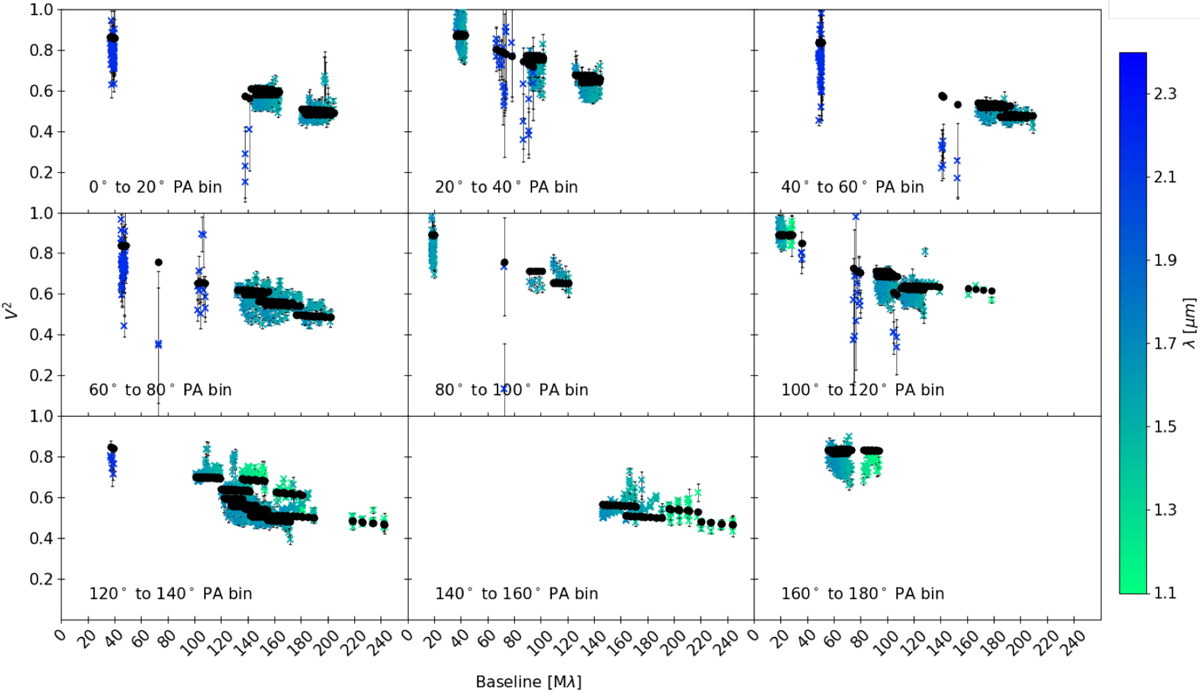
Squared visibilities plotted against spatial frequency, split by baseline position angle into 20° bins. The blue/green crosses represent the interferometric observations across all instruments, coloured according to observing wavelength: dark blue is K-band data, light blue is H-band, and green is J-band data. The black circles are the model visibilities of the best-fit temperature-gradient model corresponding to each data point.
Current usage metrics show cumulative count of Article Views (full-text article views including HTML views, PDF and ePub downloads, according to the available data) and Abstracts Views on Vision4Press platform.
Data correspond to usage on the plateform after 2015. The current usage metrics is available 48-96 hours after online publication and is updated daily on week days.
Initial download of the metrics may take a while.