Fig. 8.
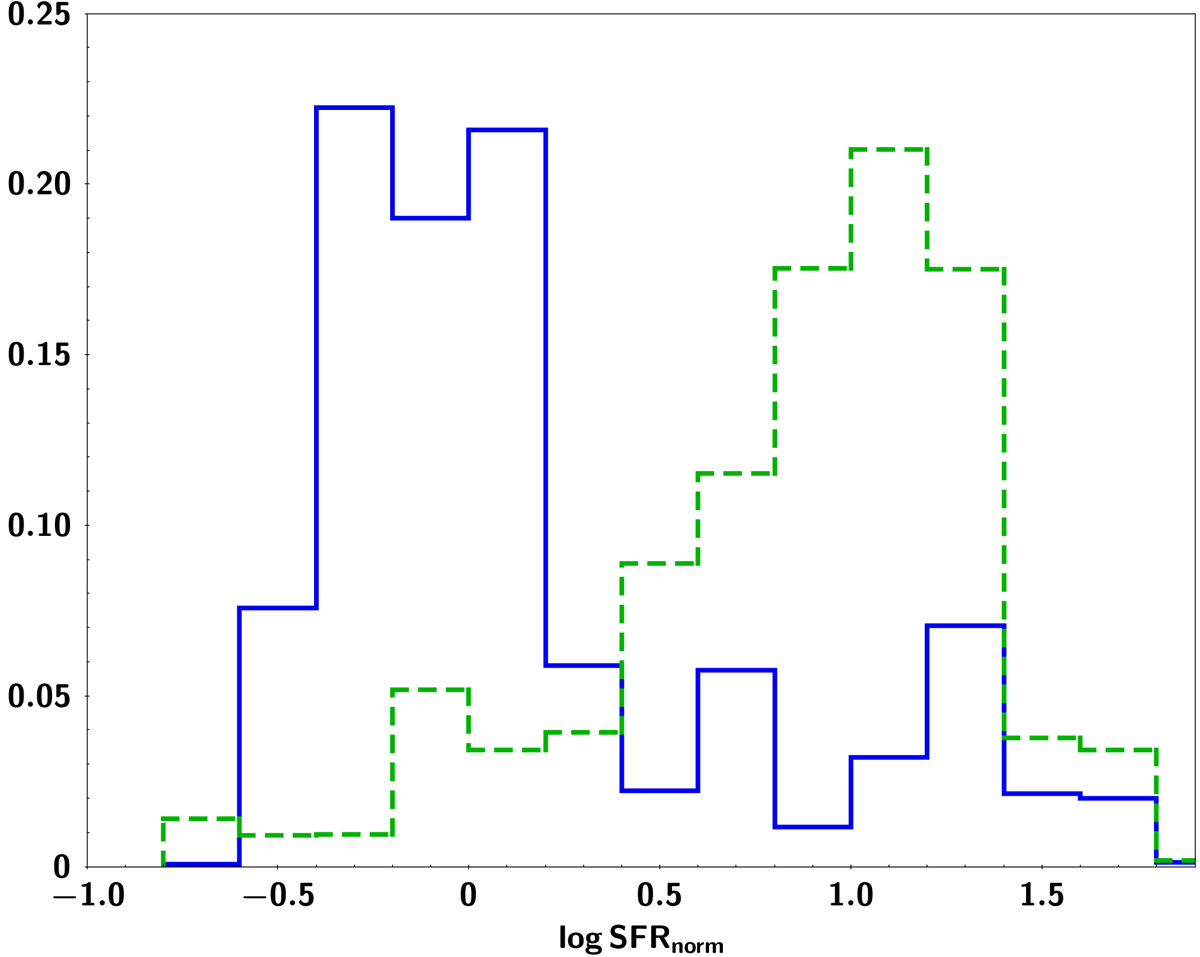
Normalised star formation rate distribution for sources at z < 1.2 (blue line) and at z > 1.2 (green dashed line). The histogram has been normalised to the total number of sources. The AGNs in the lower redshift bin have SFRs comparable with galaxies on the star-forming main sequence (log SFRnorm = 0), whereas AGNs at higher redshift have enhanced SFRs compared to galaxies on the main sequence. This suggests evolution of the SFRnorm with redshift (see text for details).
Current usage metrics show cumulative count of Article Views (full-text article views including HTML views, PDF and ePub downloads, according to the available data) and Abstracts Views on Vision4Press platform.
Data correspond to usage on the plateform after 2015. The current usage metrics is available 48-96 hours after online publication and is updated daily on week days.
Initial download of the metrics may take a while.