Fig. 11.
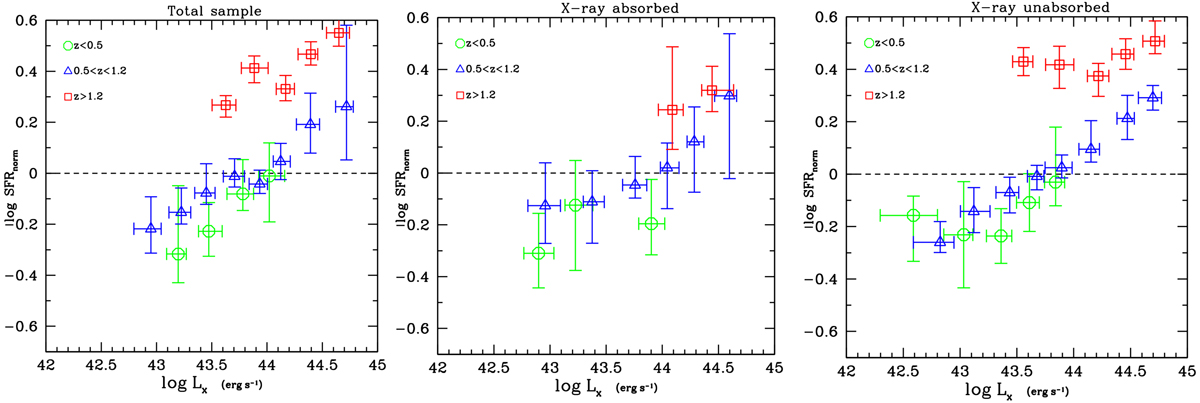
SFRnorm − LX correlation in LX bins, for different redshift intervals (z < 0.5, 0.5 < z < 1.2 and z > 1.2). Left, middle, and right panels: full sample, absorbed population, and unabsorbed population, respectively. The dashed line corresponds to the star-forming main sequence. Trends are similar in all redshift bins. Median SFR and LX values are presented. The error bars represent the 1σ dispersion of each bin.
Current usage metrics show cumulative count of Article Views (full-text article views including HTML views, PDF and ePub downloads, according to the available data) and Abstracts Views on Vision4Press platform.
Data correspond to usage on the plateform after 2015. The current usage metrics is available 48-96 hours after online publication and is updated daily on week days.
Initial download of the metrics may take a while.