| Issue |
A&A
Volume 646, February 2021
|
|
|---|---|---|
| Article Number | A116 | |
| Number of page(s) | 10 | |
| Section | Astrophysical processes | |
| DOI | https://doi.org/10.1051/0004-6361/202039103 | |
| Published online | 17 February 2021 | |
Wind mass transfer in S-type symbiotic binaries⋆
III. Confirmation of a wind focusing in EG Andromedae from the nebular [O III] λ5007 line
1
Astronomical Institute, Slovak Academy of Sciences, 059 60 Tatranská, Lomnica, Slovakia
e-mail: This email address is being protected from spambots. You need JavaScript enabled to view it.
2
P.K. Sternberg Astronomical Institute, M.V. Lomonosov Moscow State University, Moscow, Russia
3
Observatoire Rouen Sud (FR) – ARAS group, 76100 Rouen, France
Received:
4
August
2020
Accepted:
6
December
2020
Abstract
Context. The structure of the wind from the cool giants in symbiotic binaries carries important information for understanding the wind mass transfer to their white dwarf companions, its fuelling, and thus the path towards different phases of symbiotic-star evolution.
Aims. In this paper, we indicate a non-spherical distribution of the neutral wind zone around the red giant (RG) in the symbiotic binary star, EG And. We concentrate in particular on the wind focusing towards the orbital plane and its asymmetry alongside the orbital motion of the RG.
Methods. We achieved this aim by analysing the periodic orbital variations of fluxes and radial velocities of individual components of the Hα and [O III] λ5007 lines observed on our high-cadence medium (R ∼ 11 000) and high-resolution (R ∼ 38 000) spectra.
Results. The asymmetric shaping of the neutral wind zone at the near-orbital-plane region is indicated by: (i) the asymmetric course of the Hα core emission fluxes along the orbit; (ii) the presence of their secondary maximum around the orbital phase φ = 0.1, which is possibly caused by the refraction effect; and (iii) the properties of the Hα broad wing emission originating by Raman scattering on H0 atoms. The wind is substantially compressed from polar directions to the orbital plane as constrained by the location of the [O III] λ5007 line emission zones in the vicinity of the RG at/around its poles. The corresponding mass-loss rate from the polar regions of ≲10−8 M⊙ yr−1 is a factor of ≳10 lower than the average rate of ≈10−7 M⊙ yr−1 derived from nebular emission of the ionised wind from the RG. Furthermore, it is two orders of magnitude lower than that measured in the near-orbital-plane region from Rayleigh scattering.
Conclusions. The startling properties of the nebular [O III] λ5007 line in EG And provides an independent indication of the wind focusing towards the orbital plane – the key to understanding the efficient wind mass transfer in symbiotic binary stars.
Key words: binaries: symbiotic / scattering / stars: winds / outflows / stars: individual: EG And
Full Tables 1 and 2 are only available at the CDS via anonymous ftp to cdsarc.u-strasbg.fr (130.79.128.5) or via http://cdsarc.u-strasbg.fr/viz-bin/cat/J/A+A/646/A116
© ESO 2021
1. Introduction
Symbiotic stars (SySts) are the widest interacting binary systems comprising a cool giant as the donor star and a hot compact star, mostly a white dwarf (WD), accreting from the giant’s wind (Mürset & Schmid 1999). On the basis of their infrared properties, we distinguish between S-type (Stellar) and D-type (Dusty) SySts (Webster & Allen 1975). S-type systems comprise a normal red giant (RG) with typical orbital periods of a few years (e.g. Belczyński et al. 2000), while D-type systems contain a Mira-type variable and their orbital periods are considered to be of a few times 10–100 years (e.g. Matthews & Karovska 2006). The accretion process heats up the WD to ≳105 K and increases its luminosity to 101 − 104 L⊙ (Muerset et al. 1991; Skopal 2005). The accreting material converts its gravitational potential energy into the radiation by a disk (e.g. Pringle 1981), but it can also serve as a supply for stable nuclear burning on the WD surface (e.g. Paczynski & Rudak 1980). In the former case, we talk about accretion-powered systems, whose luminosities are as low as a few times 10 L⊙, while the latter are nuclear-powered systems generating luminosities of a few times 103 L⊙. Consequently, the accreting WD ionises a fraction of the wind from the RG dividing the binary environment into the ionised zone around the WD and the neutral zone around the giant, both limited by the common H0/H+ boundary (e.g. Seaquist et al. 1984; Nussbaumer & Vogel 1987). This configuration represents the so-called quiescent phase. Sometimes, SySts undergo outbursts characterised by a few magnitude brightening(s) observed on a timescale of a few months to years/decades and signatures of the enhanced mass outflow (e.g. Munari 2019).
The principal problem in the field of SySt research inheres in the large energetic output from burning WDs and the too-low accretion efficiency via the wind mass transfer in the canonical Bondi-Hoyle type of accretion (Kenyon & Gallagher 1983). The solution to this problem requires a more effective mass transfer resulting from a non-spherically symmetric wind of the donor star. For a D-type system, the binary star Mira (o Ceti), observations revealed a highly aspherical circumbinary environment with a mass outflow from Mira towards the WD (see Marengo et al. 2001; Karovska et al. 2004). Accordingly, Mohamed & Podsiadlowski (2007) suggested an efficient wind mass transfer mode for Mira-type interacting binaries, whose slow and dense wind from the evolved star on the asymptotic giant branch (AGB) is filling the Roche lobe instead of the star itself: the so-called wind Roche-lobe overflow (see also Abate et al. 2013). For S-type system SY Mus, Dumm et al. (1999) evidenced an asymmetric density distribution around the RG by measuring the hydrogen column densities, which was later confirmed by modelling its UV light curves by Shagatova & Skopal (2017). Furthermore, Shagatova et al. (2016) indicated a compression of the RG’s wind towards the orbital plane in the symbiotic binary EG And and SY Mus by modelling the H0 column densities measured from Rayleigh scattering. A possible solution to the wind mass-transfer problem in the S-type SySts was suggested by Skopal & Cariková (2015), who applied the wind compression disk model of Bjorkman & Cassinelli (1993) to slowly rotating RGs in S-type systems (Zamanov et al. 2007, 2008), which leads to the enhancement of the wind mass loss in the orbital plane. The primary aim of this paper is to demostrate a focusing of the wind from the RG in the SySt EG And independently from the previous approach of Shagatova et al. (2016).
The accretion-powered S-type symbiotic binary EG And has no history of outbursts. The binary comprises an M3.5 III RG and a WD accreting from the giant’s wind on a 483-d orbit (e.g. Fekel et al. 2000) with a high inclination of ≈80° (Vogel et al. 1992). An accretion process heats the WD to a temperature of ≈7.5 − 9.5 × 10⁴ K (Kenyon & Garcia 2016; Sion et al. 2017), producing the luminosity of a few times 10 L⊙ for a distance of 0.3 − 0.6 kpc (e.g. Muerset et al. 1991; Skopal 2005). Therefore, EG And is a low-excitation SySt with a faint nebular continuum and a few emission lines (mostly H I and some forbidden lines) superposed on the RG continuum in the optical. The quiescent phase configuration of EG And and its high orbital inclination induce pronounced spectral variations along the orbit (e.g. Smith 1980; Stencel 1984; Oliversen et al. 1985; Skopal et al. 1991; Munari 1993; Pereira 1996; Kenyon & Garcia 2016; Kondratyeva et al. 2018), which is best seen in the Hα line profile.
The true nature of the pronounced orbitally related variation in the Hα profile of quiet SySts is not well understood to date. For EG And, some authors (e.g. Tomov 1995; Ikeda & Tamura 2004; Calabrò 2014) attempted to explain this variability within the theory of colliding winds in interacting binaries suggested by Girard & Willson (1987) and Luo et al. (1990). However, the fact that a fraction of the giant’s wind has to be transferred to and accreted onto the WD excludes the presence of colliding winds, at least at/around the orbital plane (see also Walder & Folini 2000; Kenyon & Garcia 2016). On the other hand, the presence of the faint X-ray spectrum of EG And, which is of the β type (Muerset et al. 1997), is understood to be a result of a shock-heated plasma from colliding winds (see Muerset et al. 1995). These facts constrain a biconical structure of the wind from the accreting WD, which can collide with the RG wind well above the orbital plane. On the basis of 20 years of spectroscopic observations, Kenyon & Garcia (2016) confirmed the variations of Hα and Hβ equivalent widths along the orbit that are consistent with the apparent changes of the H II region arising from the ionisation of the RG wind by the hot component. A similar orbital modulation of the Hα line profile was also observed for quiescent, nuclear-powered eclipsing SySt SY Mus and RW Hya (see Schmutz et al. 1994; Schild et al. 1996). The authors suggested that the bulk of the Hα emission lies in a small high-density region above the RG surface facing the hot component. For RW Hya, they observed that the broad wings are subject to the eclipse.
To obtain information on the RG wind distribution in the symbiotic binary EG And, we investigated the orbitally related variation in the Hα and the nebular [O III] λ5007 line profiles, because these lines are created under very different physical conditions. In Sect. 2, we describe our observations and their treatment, while in Sect. 3 we present our analysis and results. The discussion and summary can be found in Sects. 4. and 5.
2. Observations
To follow the evolution of the selected emission line profiles, we used 120 high- and medium-resolution optical spectra (Table 1), from which 109 and 33 were used to analyse the Hα and the [O III] λ5007 composite line profile, respectively. The spectra were obtained during years 2015–2020 by telescopes at the Stará Lesná (G1 in Table 1) and Skalnaté Pleso (SP) observatories, complemented with those available at the Astronomical Ring for Access to Spectroscopy database (ARAS1; Teyssier 2019).
Log of spectroscopic observations.
The G1 observatory is equipped with a 0.6 m Cassegrain telescope (f/12.5) with an eShel fibre-fed spectrograph (R ∼ 11 000), and the SP observatory has a 1.3 m Nasmyth-Cassegrain telescope (f/8.36) with a fibre-fed échelle spectrograph (R ∼ 38 000) similar to the MUSICOS design (Baudrand & Bohm 1992; Pribulla et al. 2015). The G1 and SP spectra were reduced with the Image Reduction and Analysis Facility (IRAF2; Tody 1986) using specific scripts and programs (see Pribulla et al. 2015). The calibration is performed using the unit containing the ThAr hollow cathode lamp, tungsten lamp, and blue LED.
The ARAS medium-resolution spectra were obtained at the private station in Rouen with a 0.36 m Schmidt-Cassegrain telescope (F/D = 5) equipped with an Echelle spectrograph (R ∼ 11 000) and ATIK 460Ex CCD camera (2 × 2 binning). One more ARAS spectrum was obtained at the private station, Mill Ridge, with a 0.31 m Cassegrain telescope equipped with a classical slit spectrograph. The detector was a QSI583 (KAF8300 chip) binned 1 × 2 (R ∼ 9000). We also used two low-resolution ARAS spectra (Fig. 2). One taken at the orbital phase φ = 0 (obtained by J. Guarro using a Control Remote Telescope SC16, spectrograph B60050-VI, and an ATIK 460EX CCD camera) and the second one at the opposite phase, φ = 0.5 (obtained by Martineau-Buchet using a Celestron C11 telescope, LISA spectrograph, and a QSI583 wsg CCD camera). The ARAS spectra were processed and merged using Integrated Spectrographic Innovative Software (ISIS)3. The wavelength calibration is performed using the spectrum of a Thorium lamp.
All spectra were dereddened with EB − V = 0.05 mag (Muerset et al. 1991) using the extinction curve of Cardelli et al. (1989). We determined the orbital phase of the binary according to the ephemeris of the inferior conjunction of the RG (φ = 0) as follows (see Fekel et al. 2000; Kenyon & Garcia 2016):
 (1)
(1)
Moreover, we used the systemic velocity of EG And, vsys = −94.88 kms−1, as derived by Kenyon & Garcia (2016) using the SAO radial velocity data, which agree with those determined by other authors (Oliversen et al. 1985; Munari et al. 1988; Munari 1993; Fekel et al. 2000). Figure 1 shows a Hα profile in all our spectra as a function of φ in the radial velocity space, RV − RVsys.
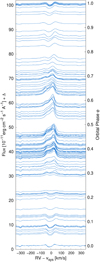 |
Fig. 1. Set of 109 spectra of EG And around the Hα line, shifted by Δ = 100 × φ in fluxes to demonstrate the orbital modulation. |
3. Analysis and results
3.1. Determination of the true continuum
To convert the spectra from relative to absolute fluxes, we used the UBVRC photometry of EG And as published by Skopal et al. (2012) and Sekeráš et al. (2019). We converted the photometric magnitudes to fluxes according to the calibration of Henden & Kaitchuck (1982). Then, we determined the level of the true continuum by scaling the spectrum at given orbital phase to the average photometric fluxes measured at the same φ. In addition, by modelling the low-resolution spectra (see Sect. 3.2.1. of Skopal et al. 2017) we obtained the spectral type of the RG as M3.4 III (see Fig. 2) using the models of Fluks et al. (1994). The corresponding synthetic spectrum then determines the profile of the true continuum of our medium- and high-resolution spectra (see Figs. 3 and 7).
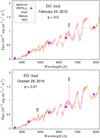 |
Fig. 2. Low-resolution spectra of EG And obtained at the orbital phase φ = 0 (top) and φ = 0.51 (bottom), demonstrating significant variations in fluxes of hydrogen lines with the orbit. The spectrum is dominated by a M3.4 III RG, while the nebular continuum is very small, and the contribution from the hot WD cannot be determined in the optical (for details, see Sect. 3.2.1. of Skopal et al. 2017). |
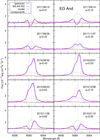 |
Fig. 3. Example of observed Hα line profile, its fit by Eq. (2), and its individual components (Sect. 3.2) at different orbital phases. Vertical dotted line corresponds to the wavelength of the systemic velocity. |
3.2. Disentangling the Hα line profile
Assuming that the Hα line consists of three basic components, the core emission, GCE(λ), the broad wings emission, GWE(λ), and the absorption, GA(λ), its profile can be expressed as
 (2)
(2)
Furthermore, we approximated each component with the following Gaussian function:
![Mathematical equation: $$ \begin{aligned} G(\lambda ) = I\exp \left[-\ln (2)\left(\frac{\lambda -\lambda _0}{h} \right)^2 \right], \end{aligned} $$](/articles/aa/full_html/2021/02/aa39103-20/aa39103-20-eq3.gif) (3)
(3)
where I is the scaling, λ0 is the central wavelength, and h is the half width at half maximum of the given component. To determine these parameters for each component, we fitted the Hα line profile with the function (2) using the code Fityk4. Figure 3 shows a preview of selected fits at different orbital phases, which demonstrates the variability of the Hα line profile along the orbit. The wavelength λ0 and parameters I, h determine the RV and the flux  ) of the given component. Values of these parameters for each component of the Hα profile of all our spectra are introduced in Table 2 and depicted in Fig. 4.
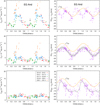 |
Fig. 4. Phase diagrams for fluxes (left) and RVs (right) of individual components of the Hα line profile; the CE (top), A (middle) and broad WE (bottom). Different orbital cycles are denoted by different colours (see the keys). The orange line represents the RV-curve of the RG, |


Fluxes and RVs of individual components of Hα line profile.
We evaluated the goodness of fits using the reduced  quantity. For all fits,
  , which corresponds to a standard deviation of fluxes of 2%. Our fitting procedure provides the errors of heights I that are often larger than 10%. This is because we did not allow the height of the CE component to vary freely, otherwise the fitting procedure would have converged to its unrealistically high values due to the degeneracy between the CE and A component. Therefore, we caution that our flux values can be considered only as lower limits. To verify the overall trend in the CE and A component fluxes, we plot their ratio in Fig. 5, which shows the maximum at φ ∼ 0.4 and the secondary maximum at φ ∼ 0.1. Finally, the uncertainties of fluxes of the disentangled components can be even larger due to calibration errors and the simplicity of our approach. Therefore, the resulting fits do not ‘perfectly’ match the observed Hα line profile (see Fig. 3).
With regard to the RV values, our fitting procedure and the resolution of our spectra allowed us to estimate their uncertainties to typically ±(1 − 5) and ±(1 − 10) km s−1 for the CE/A and the broad WE component of the Hα profile. For the [O III] λ5007 line, the uncertainties in RVs are estimated as ±(0.2 − 0.7) and ±(0.5 − 1) km s−1 for the medium- and high-resolution spectra, respectively.
3.3. Fluxes of the Hα line components
Measured fluxes of the Hα line components are plotted in Fig. 4 and summarised in Table 2. Fluxes of the CE component are strongest between φ ∼ 0.4 and ∼0.7, followed by a broad asymmetric minimum up to φ ∼ 1.4, where a steep increase towards the maximum is measured. This reflects an asymmetry of the wind density distribution with respect to the binary axis (see Sect. 4.1). Both CE and A components show a U-shaped profile between φ = 0.4 and 0.6, suggesting an attenuation effect around the superior conjunction of the RG. Its origin probably inheres in a different opacity of the nebula at different orbital phases with a maximum around φ = 0.5, where the densest parts of the nebula located between the two stars are expected (see Skopal 2008 and Sect. 4.2.2 of this paper).
A sign of the U-shaped feature around φ = 0.5 is also seen in the orbital evolution of the broad WE fluxes, while their minimum is at φ ∼ 0, implying the eclipsing nature of their source. Therefore, a substantial fraction of the broad WE source has to be located at/around the orbital plane, between the WD and the RG (see Sect. 3.4.2). Further interesting feature is the secondary maximum of the CE fluxes at φ ≈ 0.1. We speculate that the nebular light generated at/above the top of the asymmetric H0 conus can be enhanced by the refraction effect within the dense H0 zone (see Sect. 4.1).
Finally, the fact that we measure a residual emission in the Hα line around φ = 0 is a natural consequence of the ionisation structure of the binary, where a major part of the RG wind is ionised by the hard radiation from the WD (see Fig. 6).
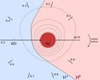 |
Fig. 6. Sketch of the basic ionisation structure for the symbiotic binary EG And in the orbital plane. The shape of the H0/H+ boundary and isodensities (dotted lines) are shown here for another quiet eclipsing symbiotic star SY Mus (see Shagatova & Skopal 2017; Shagatova 2017) because of the lack of measured H0 column densities at ingress phases for EG And. The lines of sight point to the centre of mass of the binary star (black point). Isodensities demonstrate the asymmetric density distribution of the giant’s wind in the orbital plane. In particular, a higher density gradient in front of the RG in the direction of its orbital motion than behind it (Sect. 4.1). |
3.4. Radial velocities of the Hα line components
Figure 4 shows the RVs of individual Hα line components with subtracted vsys as a function of the orbital phase φ. For comparison, we plotted the RV curve of the RG,  , according to Kenyon & Garcia (2016), as the only well-known motion of a source of radiation in the system.
3.4.1. The absorption component
Radial velocities of the absorption component basically follow the orbital motion of the RG shifted by −7.5 ± 2.5 km s−1 (Fig. 4, middle right). Such a behaviour suggests that this component is created in the vicinity of the RG, within its wind. To estimate the height above the RG photosphere (i.e. the beginning of the wind), up to which the observer can see in the absorption core, we considered the wind velocity profile of Shagatova et al. (2016):
 (4)
(4)
where r is the distance from the RG centre in units of its radius RG. The parameter of the wind model ξ determines the distance from the RG surface at which the wind starts to accelerate significantly, while the parameter K defines the steepness of this acceleration (see Figs. 1 and 2 of Shagatova 2015). Then, for RG = 75 R⊙ (Vogel et al. 1992), and ξ and K for the orbital inclination i = 80 ° ±10° (see Table 3 of Shagatova et al. 2016), a typical terminal velocity of the wind, v∞ = 30 km s−1, the measured RV of the A component relative to the RG, vA = 7.5 ± 2.5 km s−1, and the radial flow, the outer observer can see up to the height
 (5)
(5)
above the RG photosphere. For higher vA = 10 ± 2.5 km s−1, as measured around φ = 0.2 and 0.6 − 0.7, the RA value is consistent with that in Eq. (5) within their uncertainties.
3.4.2. Emission components
The most notable feature of the CE RVs is their double-wave variation along the orbit (Fig. 4, top right). From φ ∼ 0.4 to ∼0.7, they are scattered around the  curve, while between φ ∼ 0.8 and ∼1.3 they are at its opposition.
Since around φ = 0.5 we can see the densest parts of the nebula located at/above the ionisation boundary between the binary components, RVs of the CE component will obey the radial motion of the RG. At positions of φ ∼ 0.8–1.2, these parts of the nebula are occulted by the RG and its neutral wind zone. As a result, we can see a more distant nebular region better from/around the accreting WD. That explains why the RVs of the CE component are placed at the anti-phase of the  curve at these phases (Fig. 4). Around φ= 0.6−07, the CE RVs are systematically shifted by ≈–5 km s−1 relative to the
  curve. This fact can reflect an enhanced flow from the RG as suggested by recent hydrodynamical modelling (see Fig. 9 of El Mellah et al. 2020).
Broad WE components are low with a flat maximum and a terminal velocity of ∼200 km s−1 (Fig. 3). Therefore, determination of their position is rather uncertain. Nevertheless, there is a redward-shifted maximum with RVs ≳ − 5 km s−1 at φ = 0.1 − 0.3, while within the rest part of the orbit we measure a broad minimum with RVs scattered from ∼−5 to ∼−25 km s−1. A relation to the  curve shifted by ≈−10 km s−1 can be recognised (see Fig. 4, bottom right). This fact and the attenuation of this component around φ = 0 suggest that it is produced by Raman scattering of Ly-β photons from/around the accreting WD on neutral atoms of hydrogen in the densest parts of the H0 zone (see Lee 2000). In this case, the H0 atoms that move against the Ly-β photons, predominantly along the binary axis, produce the blueshifted Raman photons, while scattering by receding H0 atoms in the outer wind produce the redshifted Raman emission5. The blue Raman wing dominates the profile, because of the much higher density of the wind along the binary axis than in outer parts of the wind. Raman contributions from the neutral wind between the RG and the WD are therefore occulted around φ = 0. The systematic blueward shift of the broad WE component is partly compensated around φ = 0.1 − 0.3, where the main scattering region is drifted from the observer by the orbital motion of the RG (see Fig. 6).
3.5. Orbital variability of the [O III] λ5007 line
Our high-resolution spectra from the Skalnaté Pleso observatory (R ∼ 38 000) revealed for the first time that the [O III] λ5007 line consists of two components. Both are rather narrow; no broad wing emission is detectable (see Fig. 7). Therefore, to obtain information on the variability of the [O III] line, we fitted its profile by two Gaussian curves. The most striking variability is that in RVs (Table 3). Both the blue and the red component follow the RV curve of the RG shifted by ∼−15 and ∼+3.0 km s−1, respectively (Fig. 8). Since the coverage of the orbital cycle with our high-resolution spectra is sparse, we also measured the average RV of the unresolved [O III] λ5007 line on the medium-resolution spectra. In this way, we verified the correlation between the RV curve of the RG and the RVs of the [O III] λ5007 line (Fig. 8, top). A scatter in the [O III]-line RVs around φ = 0.6 − 0.7 is also present in RVs of the A and CE components in the Hα profile (Fig. 4). This suggests the presence of a higher velocity and variable wind from the RG at these positions.
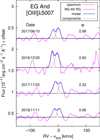 |
Fig. 7. As in Fig. 3, but for [O III] λ5007 line profile from our high-resolution spectra with the offset of 2 × φ for better visualisation. |
Radial velocities RVb and RVr of the blue and red components of the [O III] λ5007 line profile measured on our high-resolution spectra.
4. Discussion
4.1. The asymmetry of the neutral wind zone
The presence of the neutral hydrogen region in SySts is directly proved by the Rayleigh scattering of the hot star continuum around the Ly-α line on neutral atoms of hydrogen (e.g. Isliker et al. 1989). The effect allows us to measure the hydrogen column density, nH, as a function of the orbital phase. In this way, Dumm et al. (1999) presented evidence for an asymmetric density distribution around the RG in the eclipsing symbiotic binary SY Mus by comparing the egress and ingress nH values. Modelling nH(φ) values measured for SY Mus, Shagatova et al. (2016) derived the wind velocity profiles that require lower number density of the wind in front of the RG motion than behind it at distances ≳1 RG above the RG surface (see Fig. 1 of Shagatova 2017 and Fig. 6 here). As a result, the H0/H+ ionisation boundary is shaped asymmetrically with respect to the binary axis at the orbital plane (see Fig. 3 of Shagatova & Skopal 2017). Our observations support the asymmetric shaping of the H0 zone in EG And as follows.
Firstly, asymmetric distribution of the CE flux showing the highest values between φ ∼ 0.4 and ∼0.7, where its RVs follow the  curve (see Sect. 3.4.2), and the gradual decrease until φ ∼ 0.9, after which the densest parts of the nebula are not visible, are consistent with the asymmetric shaping of the H0/H+ boundary. Secondly, supposing that the shape of the ionisation boundary and isodensities are similar in quiet S-type symbiotic stars (Fig. 6), the sharp increase of the CE flux between φ = 0.3 and 0.4 by a factor of 2–3 (Fig. 4) can be explained by uncovering the dense parts of the ionised wind located in the orbital plane, just above the ionisation boundary, approximately in the direction of the RG orbital motion. Thirdly, higher fluxes of the broad WE component measured between φ ∼ 0.6 and ∼0.9 with a minimum around φ = 0 (Fig. 4), and their origin within the densest parts of the neutral wind by Raman scattering (see Sect. 3.4.2), are also consistent with the asymmetric H0 density distribution around the RG.
Finally, a fraction of the CE flux generated in the H+ zone enters the H0 zone, where it can be refracted and thus creates a local light maximum around φ = 0.1 (Fig. 4). Its position after the time of the RG inferior conjunction independently confirms the asymmetric wind density distribution around the RG, primarily derived from Rayleigh scattering (see above). A relatively narrow peak of the brightening can be a result of focusing a monochromatic light of the Hα line, while its rather broad base consists of contributions from a dense part of the nebula spread just above the H0/H+ boundary, around the binary axis.
4.2. The wind focusing towards the orbital plane
Theoretical calculations showed that the presence of a companion reduces the effective gravity of the mass-losing star in the binary, which leads to the enhancement of the wind mass loss in the orbital plane (Tout & Eggleton 1988; Frankowski & Tylenda 2001; Mohamed & Podsiadlowski 2007; de Val-Borro et al. 2009, 2017; Hadrava & Čechura 2012; Booth et al. 2016). For S-type SySts, a slow rotation of their normal RGs can also contribute to high compression of the wind towards the orbital plane (Skopal & Cariková 2015).
The first observational indication of the wind focusing from the RG in S-type SySt was suggested for SS Leporis by interferometric measurements. It was found that the RG is well below its Roche lobe. Consequently, an enhanced wind mass loss in the orbital plane is required, which fuels the abnormal luminosity of the hot component (Blind et al. 2011). Afterwards, modelling the nH(φ) values for quiescent S-type systems EG And and SY Mus, Shagatova et al. (2016) derived a factor of ≳10 higher mass-loss rates in the near-orbital-plane region than the total rate derived from nebular emission. Here, our observations indicate the wind focusing in EG And from the RVs of the nebular [O III] λ5007 line, independently of the same finding from the column density models of Shagatova et al. (2016).
4.2.1. Focusing from the [O III] λ5007 line
Figure 7 shows example of the [O III] λ5007 line profiles seen on our high-resolution spectra. The fact that the profile consists of two individual components implies the presence of two detached emitting regions. No shift in the orbital phase and almost no difference in the amplitude of their RVs with respect to the  curve imply that both regions are located in the vicinity of the RG (Fig. 8). The [O III] λ5007 line arises in the O++ ion by transitions from the metastable 1D2 to the ground 3P2 level. This line can arise only within the H+ zone, where photons capable of creating the O++ ions (hν > 35 eV) can be present. These forbidden transitions can create a strong emission in extended low density nebulae with the electron concentration ne of the order of 103 − 104 cm−3. At higher densities, a deactivation of nebular transitions mainly by free electrons weakens this line (e.g. Gurzadyan 1997). Using the corresponding deactivation factor, Skopal et al. (2001) found that faint [O III] nebular lines in the AX Per spectrum are created in the region with ne ≈ 3 × 107 cm−3, and they derived the upper limit of ne([O III]) as 7 × 107 cm−3.
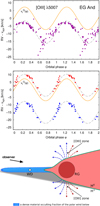 |
Fig. 8. Top: RVs of [O III] λ5007 line from medium-resolution spectra. They are shifted by −9 km s−1 (grey dashed line) from the RG motion (orange line). Middle: RVs of blue and red components of the profile from high-resolution spectra. Both components follow the RG orbital motion, being shifted by −15 and +3.0 km s−1 (grey dashed lines). Bottom: sketch of [O III] line zones in the vicinity of the RG at/around its polar regions as seen on the cut perpendicular to the orbital plane containing the binary axis (see Sect. 4.2.1). The H0/H+ boundary is estimated according to the wind compression disk model (see Fig. 2 of Skopal & Cariková 2015). |
The limiting density for emergence of the nebular [O III] lines constrains the density distribution of the wind in the vicinity of the RG. The spherically symmetric wind driven at rates of ≈10−7 M⊙ yr−1, as derived from nebular emission by Seaquist et al. (1993)6 and Skopal (2005), corresponds to particle densities > 108 cm−3 up to the radial distance from the RG centre r ∼ 5 RG (for v(r) given by Eq. (4) and v∞ = 30 km s−1), which is comparable to the separation between the binary components (Kenyon & Garcia 2016). However, the location of the nebular [O III] line region in the vicinity of the RG requires the mass-loss rate of ≲10−8 M⊙ yr−1 to achieve concentrations of a few times 107 cm−3 at r ≈ 2 − 3 RG. Therefore, the wind from the RG in EG And has to be substantially compressed towards the orbital plane to satisfy: (i) the rates of a few times 10−6 M⊙ yr−1 measured in the near-orbital-plane region from Rayleigh scattering (Shagatova et al. 2016; ii) the average rates of ≈10−7 M⊙ yr−1 derived from nebular emission of the ionised wind; and (iii) the rates of ≲10−8 M⊙ yr−1 from the polar regions required by the location of the [O III] λ5007 line zones in the vicinity of the RG.
Figure 8 shows a sketch for the [O III] line zones placed in the vicinity of the RG as allowed by the wind compression towards the orbital plane due to its rotation (see Fig. 2 of Skopal & Cariková 2015). Due to the wind compression, the H+ region is close to the RG photosphere around its poles and at the neighbouring parts with the diluted wind facing the hot component. Then, viewing the binary under the inclination angle of ∼80°, trajectories of the polar wind from the above giant’s hemisphere are directed more towards the observer, while those from the opposite hemisphere are directed away from the observer. Therefore, the wind from the polar emission zone above the orbital plane contributes mainly to the blueshifted component of the line, whereas the opposite polar emission zone is responsible for the red component. In addition, a fraction of the polar wind below the orbital plane can be occulted by the dense orbital-plane material (Fig. 8). This is supported by the fact that the blue component of the [O III] λ5007 line is shifted more from the  curve, while the red one is close to it.
4.2.2. CE and A components from wind focusing
Orbitally related variation of the CE fluxes show a factor of ∼5 difference between the maximum and minimum. The maximum is more or less rectangular in profile, with a base of Δφ ∼ 0.4 − 0.65, followed with a broad minimum lasting from φ ∼ 0.7 to φ ∼ 1.4 (see Fig. 4). Such a profile suggests that a major part of the CE flux produced by the H+ zone is occulted by the RG and/or attenuated by the neutral wind zone at these positions. As the H0 zone is flattened towards the orbital plane due to the dilution of the polar wind, a significant part of the emitting material has to be more concentrated on the orbital plane.
The maximum of the absorption component is observed around the superior conjunction of the RG, from φ ∼ 0.4 to ∼0.65, instead of the expected opposite position around φ = 0 (see Fig. 4). This anomaly, a correlation with the CE flux, can be explained by an attenuation of Hα photons within both the neutral and the ionised zone around φ = 0.5 as follows: (i) The wind enhanced at the orbital plane makes the H0 zone more dense here, shifts its boundary more to the source of ionising photons, and thus increases its optical depth. As a result, a stronger photospheric absorption within the H0 wind region is created with respect to the spherically symmetric wind. (ii) Assuming that the nebula is partially optically thick in Hα, a fraction of Hα photons produced by the H+ zone are lost from the line of sight. The highest emissivity of the nebula is expected around φ = 0.5, where its largest volume containing densest parts above the ionisation boundary around the binary axis is seen. The nebula simultaneously has the largest optical depth around this position, because of its extension here to the observer and concentration on the orbital plane7. As a result, a reduction of Hα photons on the line of sight from the H+ zone is superposed with that caused by scattering in the Hα line within the H0 zone. Therefore, the fit to the profile indicates the largest total decrease of Hα photons around φ = 0.5, and we measure a correlation between the CE flux and the flux in the A component (see Fig. 4).
5. Summary
In this paper, we analyse the orbital variability of the Hα and [O III] λ5007 line profiles observed in the spectrum of the quiescent eclipsing SySt EG And. The main goal is to obtain information on the basic structure of the wind from the RG in this wide interacting binary. Our analysis revealed two pivotal characteristics of the wind:
-
The neutral wind zone is distributed asymmetrically at the orbital plane with respect to the binary axis.
-
The wind from the RG is substantially compressed to the orbital plane from polar directions.
These conclusions are supported by the variation of fluxes and RVs of individual components of the Hα and [O III] λ5007 line profiles along the orbit (see Figs. 4 and 7). The following points are also significant:
-
Fluxes of the CE component are mostly produced by the densest region of the ionised wind located at/above the ionisation boundary facing the hot component (Sect. 3.4.2). Their asymmetric time evolution along the orbit (Sect. 3.3, Fig. 4) suggests the asymmetric shaping of the H0/H+ boundary at the orbital plane with respect to the binary axis. Also, the asymmetric wind density distribution around the RG is confirmed by the presence of the secondary maximum of the CE fluxes around φ = 0.1, which can result from refraction of the CE light in the neutral wind. Fluxes and RVs of the broad WE component, which originate from the densest parts of the neutral wind by Raman scattering, also reflect the asymmetric density distribution of H0 atoms around the RG (Sect. 4.1).
-
A substantial compression of the RG wind to the orbital plane is constrained by the location of the nebular [O III] line zones in the vicinity of the RG (r ≈ 2 − 3 RG), at/around its poles. This requires the mass-loss rate of ≲10−8 M⊙ yr−1 from the polar regions (Sect. 4.2.1, Fig. 8) to be two orders of magnitude lower than that measured in the near-orbital-plane region from Rayleigh scattering.
Finally, we remark that the substantial focusing of the wind towards the orbital plane can mimic the ellipsoidal shape of the RG, and thus cause the double-wave profile of the optical light curves along the orbit even for systems containing RGs well within their Roche lobes – a long-standing problem for the interpretation of this type of variability for EG And (Wilson & Vaccaro 1997; Skopal 2001; Kenyon & Garcia 2016; Sekeráš et al. 2019). This problem is remarkable mainly for yellow SySts, whose G-K giants are deeply inside of their Roche lobes, but their optical light curves show a pronounced double-wave profile (see Fig. 6.2 of Munari 2019).
In this way, Schmid et al. (1999) explained the blue adjacent component in the Raman scattered O VI λ6825 profile in some SySts.
The radio emission was measured around φ = 0 and the distance d = 0.31 kpc was used to derive ṀG ≈ 10−8 M⊙ yr−1. Estimating the radio emission for φ ∼ 0.5 from the total emission measure at this phase (see Table 3 of Skopal 2005) yields ṀG ≈ 10−7 M⊙ yr−1 for d = 0.59 kpc.
That is, a shorter recombination time in a denser nebula increases the fraction of the H0 atoms in the H+ zone, which makes it more opaque for diffuse Hα photons.
Acknowledgments
The authors are grateful to Matej Sekeráš for obtaining a fraction of the spectroscopic observations used in this work and helpful discussions concerning the data reduction. Theodor Pribulla is acknowledged for the advice on verification of the wavelength calibration of the spectra. Yolande Buchet, Zoltán Garai, Joan Guarro Flo, Tim Lester, Gerard Martineau, Theodor Pribulla, Peter Sivanič and Martin Vaňko are thanked for obtaining 1–2 spectra. Some spectra were acquired within the Astronomical Ring for Access to Spectroscopy (ARAS), an initiative promoting cooperation between professional and amateur astronomers in the field of spectroscopy, coordinated by François Teyssier. This work was supported by the Slovak Research and Development Agency under the contract No. APVV-15-0458 and by a grant of the Slovak Academy of Sciences, VEGA No. 2/0008/17.
References
- Abate, C., Pols, O. R., Izzard, R. G., Mohamed, S. S., & de Mink, S. E. 2013, A&A, 552, A26 [NASA ADS] [CrossRef] [EDP Sciences] [Google Scholar]
- Baudrand, J., & Bohm, T. 1992, A&A, 259, 711 [NASA ADS] [Google Scholar]
- Belczyński, K., Mikołajewska, J., Munari, U., Ivison, R. J., & Friedjung, M. 2000, A&AS, 146, 407 [NASA ADS] [CrossRef] [EDP Sciences] [Google Scholar]
- Bjorkman, J. E., & Cassinelli, J. P. 1993, ApJ, 409, 429 [Google Scholar]
- Blind, N., Boffin, H. M. J., Berger, J. P., et al. 2011, A&A, 536, A55 [NASA ADS] [CrossRef] [EDP Sciences] [Google Scholar]
- Booth, R. A., Mohamed, S., & Podsiadlowski, P. 2016, MNRAS, 457, 822 [Google Scholar]
- Calabrò, E. 2014, JApA, 35, 69 [Google Scholar]
- Cardelli, J. A., Clayton, G. C., & Mathis, J. S. 1989, ApJ, 345, 245 [NASA ADS] [CrossRef] [Google Scholar]
- de Val-Borro, M., Karovska, M., & Sasselov, D. 2009, ApJ, 700, 1148 [NASA ADS] [CrossRef] [Google Scholar]
- de Val-Borro, M., Karovska, M., Sasselov, D. D., & Stone, J. M. 2017, MNRAS, 468, 3408 [Google Scholar]
- Dumm, T., Schmutz, W., Schild, H., & Nussbaumer, H. 1999, A&A, 349, 169 [NASA ADS] [Google Scholar]
- El Mellah, I., Bolte, J., Decin, L., Homan, W., & Keppens, R. 2020, A&A, 637, A91 [NASA ADS] [CrossRef] [EDP Sciences] [Google Scholar]
- Fekel, F. C., Joyce, R. R., Hinkle, K. H., & Skrutskie, M. F. 2000, AJ, 119, 1375 [Google Scholar]
- Fluks, M. A., Plez, B., The, P. S., et al. 1994, A&AS, 105, 311 [NASA ADS] [Google Scholar]
- Frankowski, A., & Tylenda, R. 2001, A&A, 367, 513 [NASA ADS] [CrossRef] [EDP Sciences] [Google Scholar]
- Girard, T., & Willson, L. A. 1987, A&A, 183, 247 [NASA ADS] [Google Scholar]
- Gurzadyan, G. A. 1997, The Physics and Dynamics of Planetary Nebulae (Berlin, Heidelberg, New-York: Springer-Verlag) [Google Scholar]
- Hadrava, P., & Čechura, J. 2012, A&A, 542, A42 [NASA ADS] [CrossRef] [EDP Sciences] [Google Scholar]
- Henden, A. A., & Kaitchuck, R. H. 1982, Astronomical photometry (New York: Van Nostrand Reinhold Company) [Google Scholar]
- Ikeda, Y., & Tamura, S. 2004, PASJ, 56, 353 [NASA ADS] [Google Scholar]
- Isliker, H., Nussbaumer, H., & Vogel, M. 1989, A&A, 219, 271 [NASA ADS] [Google Scholar]
- Karovska, M., Wood, B., Marengo, M., et al. 2004, in Rev. Mex. Astron. Astrofis. Ser., eds. G. Tovmassian, E. Sion, et al., 20, 92 [Google Scholar]
- Kenyon, S. J., & Gallagher, J. S. 1983, AJ, 88, 666 [Google Scholar]
- Kenyon, S. J., & Garcia, M. R. 2016, AJ, 152, 1 [Google Scholar]
- Kondratyeva, I. N., Rspaev, F. K., Reva, I. V., & Krugov, M. A. 2018, Astrophysics, 61, 310 [Google Scholar]
- Lee, H.-W. 2000, ApJ, 541, L25 [Google Scholar]
- Luo, D., McCray, R., & Mac Low, M.-M. 1990, ApJ, 362, 267 [Google Scholar]
- Marengo, M., Karovska, M., Fazio, G. G., et al. 2001, ApJ, 556, L47 [Google Scholar]
- Matthews, L. D., & Karovska, M. 2006, ApJ, 637, L49 [Google Scholar]
- Mohamed, S., & Podsiadlowski, P. 2007, in Wind Roche-Lobe Overflow: a New Mass-Transfer Mode for Wide Binaries, eds. R. Napiwotzki, & M. R. Burleigh, ASP Conf. Ser., 372, 397 [Google Scholar]
- Muerset, U., Nussbaumer, H., Schmid, H. M., & Vogel, M. 1991, A&A, 248, 458 [Google Scholar]
- Muerset, U., Jordan, S., & Walder, R. 1995, A&A, 297, L87 [Google Scholar]
- Muerset, U., Wolff, B., & Jordan, S. 1997, A&A, 319, 201 [Google Scholar]
- Munari, U. 1993, A&A, 273, 425 [NASA ADS] [Google Scholar]
- Munari, U. 2019, Cambridge Astrophys. Ser., 54, 77 [Google Scholar]
- Munari, U., Margoni, R., Iijima, T., & Mammano, A. 1988, A&A, 198, 173 [Google Scholar]
- Mürset, U., & Schmid, H. M. 1999, A&AS, 137, 473 [NASA ADS] [CrossRef] [EDP Sciences] [Google Scholar]
- Nussbaumer, H., & Vogel, M. 1987, A&A, 182, 51 [NASA ADS] [Google Scholar]
- Oliversen, N. A., Anderson, C. M., Stencel, R. E., & Slovak, M. H. 1985, ApJ, 295, 620 [Google Scholar]
- Paczynski, B., & Rudak, B. 1980, A&A, 82, 349 [Google Scholar]
- Pereira, C. B. 1996, Ap&SS, 235, 305 [Google Scholar]
- Pribulla, T., Garai, Z., Hambálek, L., et al. 2015, Astron. Nachr., 336, 682 [Google Scholar]
- Pringle, J. E. 1981, ARA&A, 19, 137 [Google Scholar]
- Schild, H., Muerset, U., & Schmutz, W. 1996, A&A, 306, 477 [NASA ADS] [Google Scholar]
- Schmid, H. M., Krautter, J., Appenzeller, I., et al. 1999, A&A, 348, 950 [NASA ADS] [Google Scholar]
- Schmutz, W., Schild, H., Muerset, U., & Schmid, H. M. 1994, A&A, 288, 819 [NASA ADS] [Google Scholar]
- Seaquist, E. R., Taylor, A. R., & Button, S. 1984, ApJ, 284, 202 [Google Scholar]
- Seaquist, E. R., Krogulec, M., & Taylor, A. R. 1993, ApJ, 410, 260 [Google Scholar]
- Sekeráš, M., Skopal, A., Shugarov, S., et al. 2019, Contrib. Astron. Obs. Skalnate Pleso, 49, 19 [Google Scholar]
- Shagatova, N. 2015, Contrib. Astron. Obs. Skalnate Pleso, 45, 89 [Google Scholar]
- Shagatova, N. 2017, PASP, 129, 067001 [Google Scholar]
- Shagatova, N., & Skopal, A. 2017, A&A, 602, A71 [Google Scholar]
- Shagatova, N., Skopal, A., & Cariková, Z. 2016, A&A, 588, A83 [NASA ADS] [CrossRef] [EDP Sciences] [Google Scholar]
- Sion, E. M., Godon, P., Mikolajewska, J., Sabra, B., & Kolobow, C. 2017, AJ, 153, 160 [Google Scholar]
- Skopal, A. 2001, A&A, 366, 157 [Google Scholar]
- Skopal, A. 2005, A&A, 440, 995 [NASA ADS] [CrossRef] [EDP Sciences] [Google Scholar]
- Skopal, A. 2008, JAAVSO, 36, 9 [Google Scholar]
- Skopal, A., & Cariková, Z. 2015, A&A, 573, A8 [Google Scholar]
- Skopal, A., Chochol, D., Vittone, A. A., Blanco, C., & Mammano, A. 1991, A&A, 245, 531 [Google Scholar]
- Skopal, A., Teodorani, M., Errico, L., et al. 2001, A&A, 367, 199 [NASA ADS] [CrossRef] [EDP Sciences] [Google Scholar]
- Skopal, A., Shugarov, S., Vaňko, M., et al. 2012, Astron. Nachr., 333, 242 [Google Scholar]
- Skopal, A., Shugarov, S. Y., Sekeráš, M., et al. 2017, A&A, 604, A48 [NASA ADS] [CrossRef] [EDP Sciences] [Google Scholar]
- Smith, S. E. 1980, ApJ, 237, 831 [Google Scholar]
- Stencel, R. E. 1984, ApJ, 281, L75 [Google Scholar]
- Teyssier, F. 2019, Contrib. Astron. Obs. Skalnate Pleso, 49, 217 [Google Scholar]
- Tody, D. 1986, in Proc. SPIE, ed. D. L. Crawford, SPIE Conf. Ser., 627, 733 [Google Scholar]
- Tomov, N. A. 1995, MNRAS, 272, 189 [Google Scholar]
- Tout, C. A., & Eggleton, P. P. 1988, MNRAS, 231, 823 [Google Scholar]
- Vogel, M., Nussbaumer, H., & Monier, R. 1992, A&A, 260, 156 [NASA ADS] [Google Scholar]
- Walder, R., & Folini, D. 2000, in Thermal and Ionization Aspects of Flows from Hot Stars, eds. H. Lamers, & A. Sapar, ASP Conf. Ser., 204, 331 [Google Scholar]
- Webster, B. L., & Allen, D. A. 1975, MNRAS, 171, 171 [NASA ADS] [CrossRef] [Google Scholar]
- Wilson, R. E., & Vaccaro, T. R. 1997, MNRAS, 291, 54 [Google Scholar]
- Zamanov, R. K., Bode, M. F., Melo, C. H. F., et al. 2007, MNRAS, 380, 1053 [Google Scholar]
- Zamanov, R. K., Bode, M. F., Melo, C. H. F., et al. 2008, MNRAS, 390, 377 [Google Scholar]
All Tables
Radial velocities RVb and RVr of the blue and red components of the [O III] λ5007 line profile measured on our high-resolution spectra.
All Figures
|
Fig. 1. Set of 109 spectra of EG And around the Hα line, shifted by Δ = 100 × φ in fluxes to demonstrate the orbital modulation. |
| In the text | |
|
Fig. 2. Low-resolution spectra of EG And obtained at the orbital phase φ = 0 (top) and φ = 0.51 (bottom), demonstrating significant variations in fluxes of hydrogen lines with the orbit. The spectrum is dominated by a M3.4 III RG, while the nebular continuum is very small, and the contribution from the hot WD cannot be determined in the optical (for details, see Sect. 3.2.1. of Skopal et al. 2017). |
| In the text | |
|
Fig. 3. Example of observed Hα line profile, its fit by Eq. (2), and its individual components (Sect. 3.2) at different orbital phases. Vertical dotted line corresponds to the wavelength of the systemic velocity. |
| In the text | |
|
Fig. 4. Phase diagrams for fluxes (left) and RVs (right) of individual components of the Hα line profile; the CE (top), A (middle) and broad WE (bottom). Different orbital cycles are denoted by different colours (see the keys). The orange line represents the RV-curve of the RG, |
| In the text | |
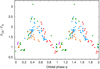 |
Fig. 5. As in Fig. 4, but for flux ratio of the CE and A components. |
| In the text | |
|
Fig. 6. Sketch of the basic ionisation structure for the symbiotic binary EG And in the orbital plane. The shape of the H0/H+ boundary and isodensities (dotted lines) are shown here for another quiet eclipsing symbiotic star SY Mus (see Shagatova & Skopal 2017; Shagatova 2017) because of the lack of measured H0 column densities at ingress phases for EG And. The lines of sight point to the centre of mass of the binary star (black point). Isodensities demonstrate the asymmetric density distribution of the giant’s wind in the orbital plane. In particular, a higher density gradient in front of the RG in the direction of its orbital motion than behind it (Sect. 4.1). |
| In the text | |
|
Fig. 7. As in Fig. 3, but for [O III] λ5007 line profile from our high-resolution spectra with the offset of 2 × φ for better visualisation. |
| In the text | |
|
Fig. 8. Top: RVs of [O III] λ5007 line from medium-resolution spectra. They are shifted by −9 km s−1 (grey dashed line) from the RG motion (orange line). Middle: RVs of blue and red components of the profile from high-resolution spectra. Both components follow the RG orbital motion, being shifted by −15 and +3.0 km s−1 (grey dashed lines). Bottom: sketch of [O III] line zones in the vicinity of the RG at/around its polar regions as seen on the cut perpendicular to the orbital plane containing the binary axis (see Sect. 4.2.1). The H0/H+ boundary is estimated according to the wind compression disk model (see Fig. 2 of Skopal & Cariková 2015). |
| In the text | |
Current usage metrics show cumulative count of Article Views (full-text article views including HTML views, PDF and ePub downloads, according to the available data) and Abstracts Views on Vision4Press platform.
Data correspond to usage on the plateform after 2015. The current usage metrics is available 48-96 hours after online publication and is updated daily on week days.
Initial download of the metrics may take a while.