Fig. 8.
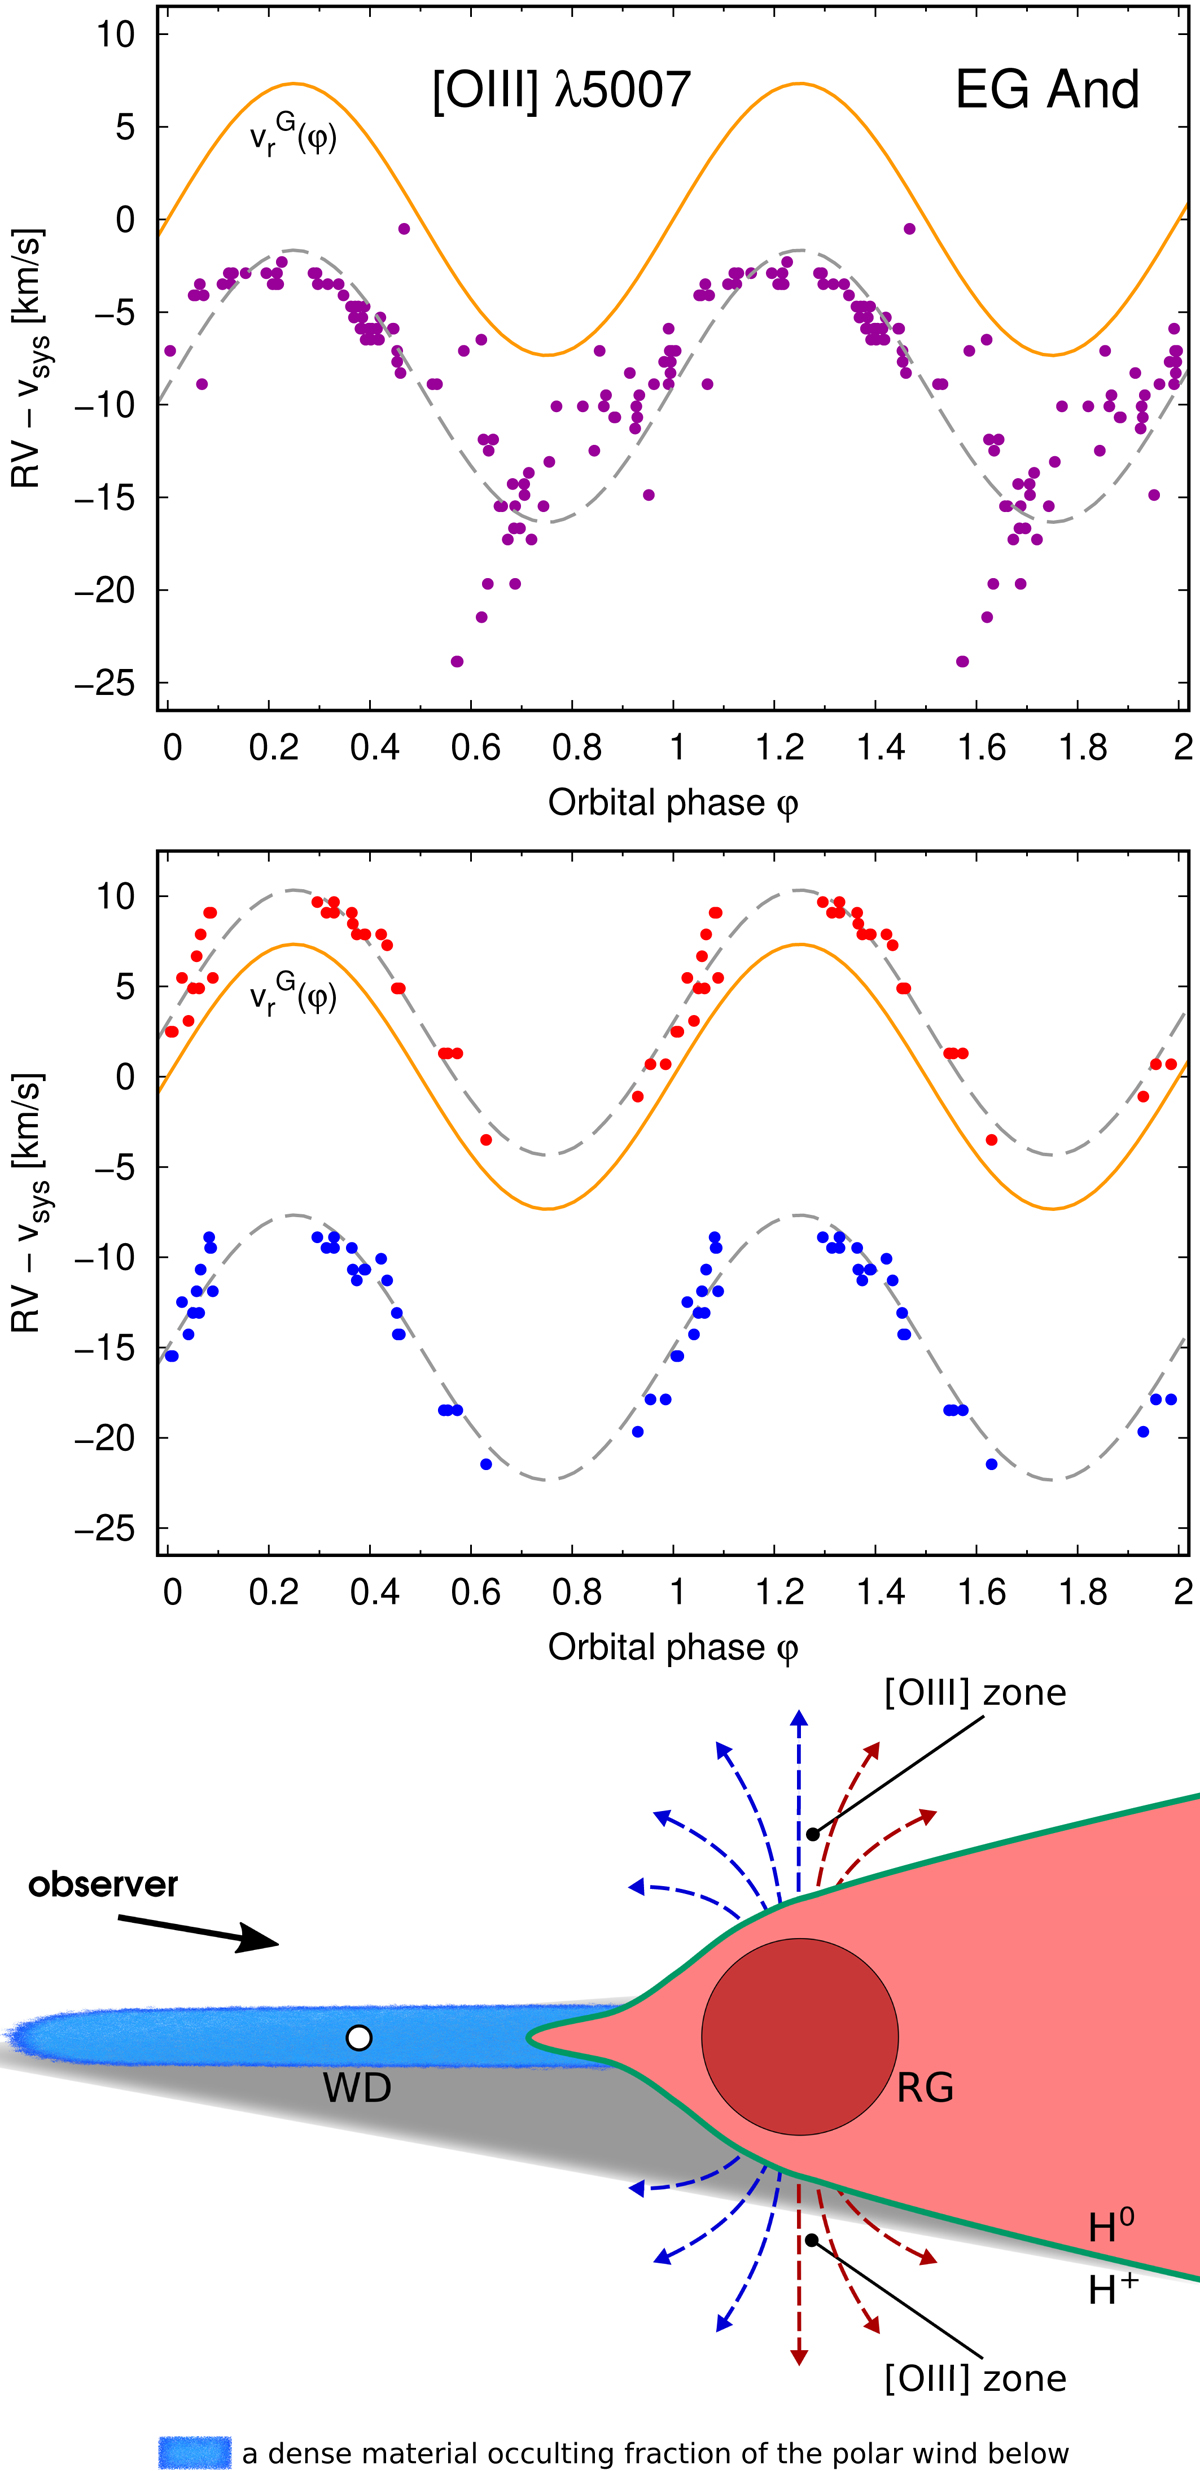
Top: RVs of [O III] λ5007 line from medium-resolution spectra. They are shifted by −9 km s−1 (grey dashed line) from the RG motion (orange line). Middle: RVs of blue and red components of the profile from high-resolution spectra. Both components follow the RG orbital motion, being shifted by −15 and +3.0 km s−1 (grey dashed lines). Bottom: sketch of [O III] line zones in the vicinity of the RG at/around its polar regions as seen on the cut perpendicular to the orbital plane containing the binary axis (see Sect. 4.2.1). The H0/H+ boundary is estimated according to the wind compression disk model (see Fig. 2 of Skopal & Cariková 2015).
Current usage metrics show cumulative count of Article Views (full-text article views including HTML views, PDF and ePub downloads, according to the available data) and Abstracts Views on Vision4Press platform.
Data correspond to usage on the plateform after 2015. The current usage metrics is available 48-96 hours after online publication and is updated daily on week days.
Initial download of the metrics may take a while.