Fig. 4.
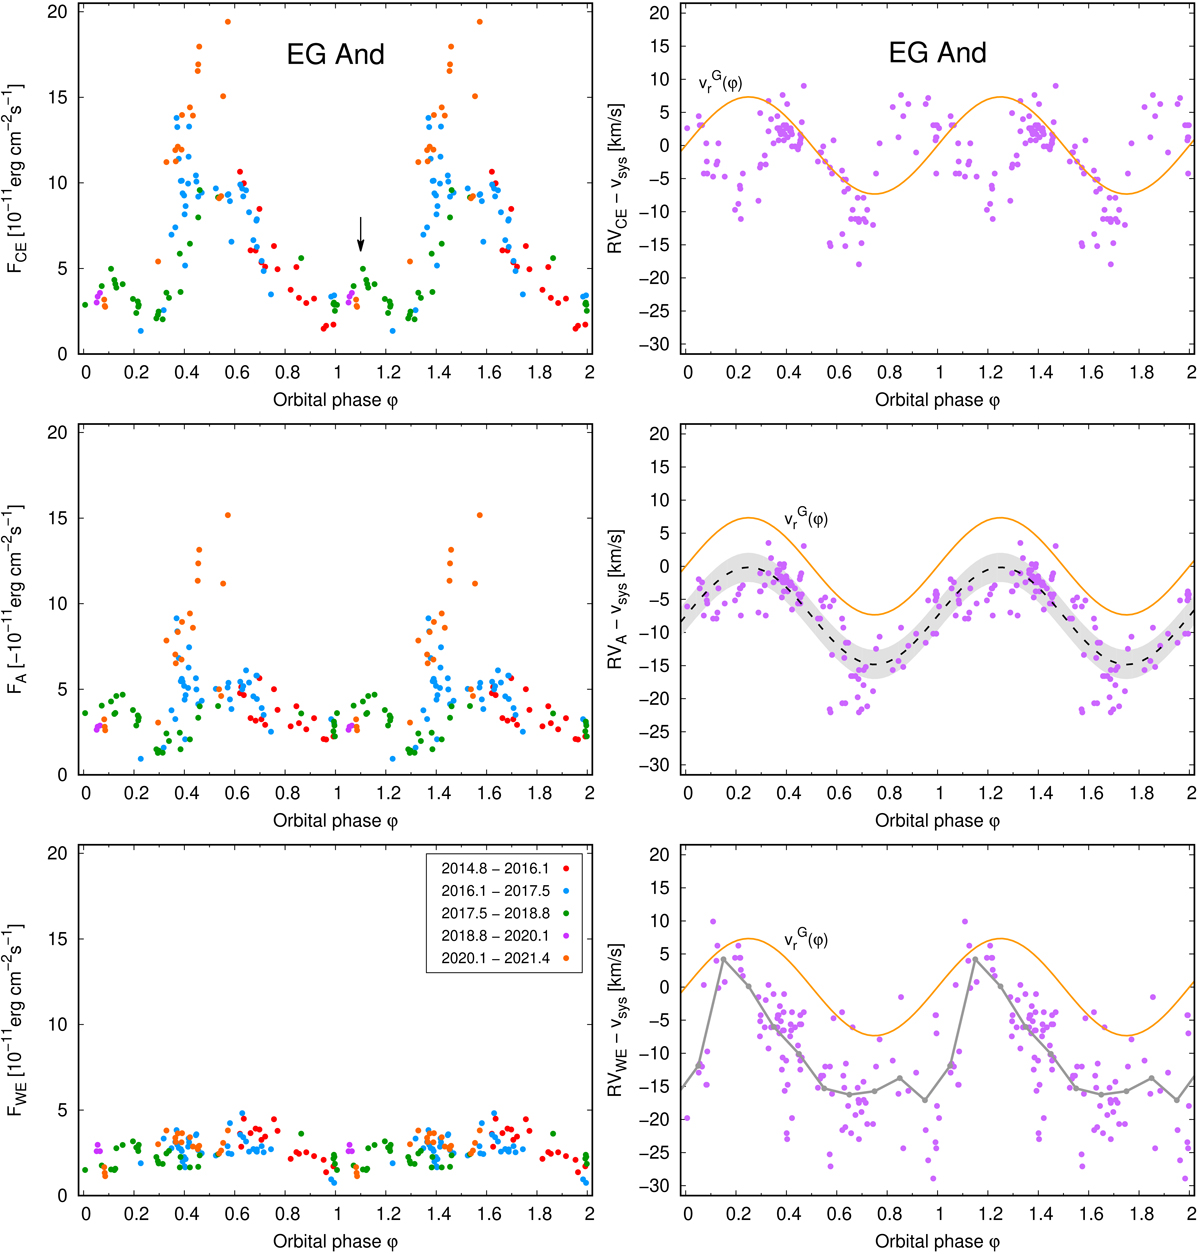
Phase diagrams for fluxes (left) and RVs (right) of individual components of the Hα line profile; the CE (top), A (middle) and broad WE (bottom). Different orbital cycles are denoted by different colours (see the keys). The orange line represents the RV-curve of the RG, ![]() . The arrow in the top-left panel marks the brightening, possibly caused by the refraction effect (Sect. 4.1). The right-middle panel shows the shift of the A component (dashed line) relative to
. The arrow in the top-left panel marks the brightening, possibly caused by the refraction effect (Sect. 4.1). The right-middle panel shows the shift of the A component (dashed line) relative to ![]() , with the grey belt illustrating average uncertainty in measuring RVs (Sect. 3.4.1). The grey line in the bottom-right panel represents binned RVs of the broad WE component with the bin width 0.1 of the orbital phase. Data are in Table 2.
, with the grey belt illustrating average uncertainty in measuring RVs (Sect. 3.4.1). The grey line in the bottom-right panel represents binned RVs of the broad WE component with the bin width 0.1 of the orbital phase. Data are in Table 2.
Current usage metrics show cumulative count of Article Views (full-text article views including HTML views, PDF and ePub downloads, according to the available data) and Abstracts Views on Vision4Press platform.
Data correspond to usage on the plateform after 2015. The current usage metrics is available 48-96 hours after online publication and is updated daily on week days.
Initial download of the metrics may take a while.