| Issue |
A&A
Volume 644, December 2020
|
|
|---|---|---|
| Article Number | A116 | |
| Number of page(s) | 19 | |
| Section | Extragalactic astronomy | |
| DOI | https://doi.org/10.1051/0004-6361/202039530 | |
| Published online | 08 December 2020 | |
The kinematics of young and old stellar populations in nuclear rings of MUSE TIMER galaxies
1
Instituto de Astrofísica de Canarias, 38205 San Cristóbal de La Laguna, Santa Cruz de Tenerife, Spain
e-mail: drb@iac.es
2
Departamento de Astrofísica, Universidad de La Laguna, 38205 San Cristóbal de La Laguna, Santa Cruz de Tenerife, Spain
3
European Southern Observatory, Karl-Schwarzschild-Str. 2, 85748 Garching bei München, Germany
4
Ludwig-Maximilians-Universität, Professor-Huber-Platz 2, 80539 München, Germany
5
Institute of Cosmology and Gravitation, University of Portsmouth, Burnaby Road, Portsmouth PO1 3FX, UK
6
Dpto. de Física y del Cosmos, Campus de Fuentenueva, Edificio Mecenas, Universidad de Granada, 18071 Granada, Spain
7
Instituto Carlos I de Física Teórica y Computacional, Facultad de Ciencias, 18071 Granada, Spain
8
Observatorio Astronómico Nacional (IGN), C/ Alfonso XII 3, 28014 Madrid, Spain
9
Departamento de Física de la Tierra y Astrofísica, Universidad Complutense de Madrid, 28040 Madrid, Spain
10
IPARCOS, Facultad de C.C. Físicas, Universidad Complutense de Madrid, 28040 Madrid, Spain
11
Instituto de Astronomia, Geofísica e Ciências Atmosféricas, Universidade de São Paulo, São Paulo, SP, Brazil
12
Astrophysics Research Institute, Liverpool John Moores University, 146 Brownlow Hill, L3 5RF Liverpool, UK
13
Department of Astrophysics, University of Vienna Türkenschanzstraße 17, 1180 Vienna, Austria
14
Department of Astronomy and Atmospheric Sciences, Kyungpook National University, Daegu 702-701, Korea
Received:
25
September
2020
Accepted:
20
October
2020
Context. Studying the stellar kinematics of galaxies is a key tool in the reconstruction of their evolution. However, the current measurements of the stellar kinematics are complicated by several factors, including dust extinction and the presence of multiple stellar populations.
Aims. We use integral field spectroscopic data of four galaxies from the Time Inference with MUSE in Extragalactic Rings (TIMER) survey to explore and compare the kinematics measured in different spectral regions that are sensitive to distinct stellar populations.
Methods. We derive the line-of-sight velocity and velocity dispersion of both a young (≲2 Gyr) and an old stellar population from the spectral regions around the Hβ line and the Ca II Triplet. In addition, we determine colour excess, mean age, and metallicity.
Results. We report a correlation of the colour excess with the difference in the kinematic parameters of the Hβ line and the Ca II Triplet range, which are dominated by young and old stellar populations, respectively. Young stellar populations, located primarily in nuclear rings, have higher velocity dispersions than old ones. These differences in the rings are typically ∼10 km s−1 in velocity dispersion but can have a mean value as high as ∼24 km s−1 in the most extreme case. Trends with age exist in the nuclear rings but are less significant than those with dust extinction. We report different degrees of correlation for these trends among the galaxies in the sample, which are related to the size of the Voronoi bins in their rings. No clear trends for the line-of-sight velocity differences are observed. The absence of these trends can be explained as a consequence of the Hβ line masking process during the kinematic extraction, as confirmed by dedicated simulations.
Conclusions. Our study demonstrates that kinematic differences caused by different stellar populations can be identified in the central regions of nearby galaxies, even from intermediate resolution spectroscopy. This opens the door to future detailed chemo-kinematic studies of galaxies, but also serves as a warning against deriving kinematics from full-spectrum fitting across very wide wavelength ranges when intense star formation is taking place.
Key words: galaxies: kinematics and dynamics / galaxies: evolution / galaxies: stellar content / galaxies: structure / galaxies: general
© ESO 2020
1. Introduction
The evolution of galaxies is one of the most important topics in extragalactic astronomy. Galaxies evolve in different ways under the influence of internal or external processes, leading to different morphologies (Kormendy & Kennicutt 2004). Internal secular processes are slow, with timescales equivalent to several times the rotation period of the galaxy (e.g. Kormendy 1979, 2013; Combes & Sanders 1981; Binney & Merrifield 1998; Kormendy & Kennicutt 2004), but they are particularly relevant in the low-density regions of the Universe preferred by late-type galaxies.
Massive discs and bars play an important role in secular evolution. Galactic bars are formed in the early stages of a galaxy lifetime (Sheth et al. 2012), shortly after the disc is settled and becomes dynamically cold. The bar behaves like a true engine of galaxy evolution, driving the distribution of angular momentum in the disc and causing gas inflow. Disc gas can be funnelled towards the inner regions of a galaxy, where it can lead to new structures or even help fuel active galactic nucleus (AGN) activity (e.g. Combes & Gerin 1985; Shlosman et al. 1989; Sakamoto et al. 1999; Regan & Teuben 2004; Sheth et al. 2005; Sormani et al. 2015). Nuclear rings are stimulated by the gas inflow that is driven by the bar to the central parts of the galaxy. The gas inflow stagnates near inner Lindblad dynamical resonances where the gas piles up, shocks, and leads to star formation (e.g. Knapen et al. 1995; Piner et al. 1995; Buta & Combes 1996; Rautiainen & Salo 2000; Maoz et al. 2001; Falcón-Barroso et al. 2006; Comerón et al. 2010). Studying the kinematics of older and younger stellar populations in nuclear rings can provide valuable information on when and how rings and bars were built and thus also on when the disc settled (Gadotti et al. 2015, 2019).
The evolution of the inner structures of a galaxy can be studied using both theoretical and observational approaches. In the last few decades, the theoretical approach, mainly based on hydrodynamical simulations, has advanced significantly. These simulations can reproduce the kinematics of a wide variety of galaxies at different redshifts and thus contribute to the development of a general understanding of galaxy evolution. Models like EAGLE (Schaye et al. 2015) and IllustrisTNG (Pillepich et al. 2018) have become very popular and successfully replicate the results of key observations.
On the observational side, technical advances have resulted in tremendous progress. One such advance is the introduction of integral-field spectroscopy (IFS), from which spatially resolved maps of gas and stellar kinematics in galaxies can be derived. Combining IFS data with stellar population models has allowed for the study of the distribution of the kinematics, age, metallicity, extinction, and colour of the stellar populations in different parts of galaxies at unprecedented resolution. From the first implementations with instruments such as OASIS or SAURON (e.g. Bacon et al. 2001), IFS has evolved into revolutionary instruments like VIMOS (Le Fèvre et al. 2003), SINFONI (Eisenhauer et al. 2003; Bonnet et al. 2004), PMAS/PPaK (Roth et al. 2005; Verheijen et al. 2004; Kelz et al. 2006), MUSE (Bacon et al. 2010), or MEGARA (Gil de Paz et al. 2014, 2018; Carrasco et al. 2018), and into surveys such as ATLAS3D (Cappellari et al. 2011), SAMI (Croom et al. 2012), MaNGA (Bundy et al. 2015), CALIFA (Sánchez et al. 2016), or TIMER (Gadotti et al. 2015, 2019).
Here we use IFS data to study the secular evolution of galaxies by analysing the kinematics of different stellar populations, as well as their relationship with parameters such as dust content, stellar age, and metallicity. In past studies, Davies (1990) and Bosma et al. (1992) quantified how absorption affects the rotation curves in the inner regions of late-type galaxies. These works were later supplemented with mainly Monte Carlo simulations for low surface brightness (Matthews & Wood 2001), elliptical (Baes & Dejonghe 2000; Baes et al. 2000), and disc galaxies (Baes et al. 2003), as well as with studies using IFS data cubes leading to analytical methods for extracting the kinematics and the stellar population parameters (e.g. Ocvirk et al. 2006; Chilingarian et al. 2007). These methods, based on the fitting of IFS data in their full spectral range to single-age and single-metallicity stellar population (SSP) models (Bruzual & Charlot 2003; Vazdekis 1999; Vazdekis et al. 2010), have been successfully applied to several scenarios: the separation of counter-rotating populations in discs (Coccato et al. 2013; Johnston et al. 2013), bulge-disc decomposition (Johnston et al. 2017; Tabor et al. 2017, 2019; Méndez-Abreu et al. 2019a,b), galaxy-halo separation (Johnston et al. 2018a), and kinematically decoupled cores (KDC, Johnston et al. 2018b).
McDermid (2002)1 studied the kinematics of different stellar populations by assuming that different spectral regions are sensitive to stars of different ages. He extracted the line-of-sight velocity distribution parameters (v⋆, σ⋆, h3, and h4) for a young stellar population, traced by the Hβ line, and an old one, traced by the Ca II Triplet, and showed that the enhanced Hβ absorption exhibited by elliptical galaxies may be produced by the presence of a disc formed by young stars.
The aim of the present work is to quantify how the kinematics of young (≲2 Gyr) and old stellar populations differ in the nuclear rings of a small sample of disc galaxies, and to explore relations with age, stellar metallicity, and extinction. We extract the line-of-sight velocity and velocity dispersion to characterise the kinematics of the young and old stellar populations using the Hβ line and the Ca II Triplet, respectively. We compare our results with ages and metallicities obtained from the analysis of the data using the Galaxy IFU Spectroscopy Tool (GIST) pipeline (Bittner et al. 2020) as well as the extinction as obtained from the fitting of the full spectra.
The paper is structured as follows. In Sect. 2 we present the galaxies we used for our study. Section 3 provides a detailed explanation of the methods and tools employed for the analysis of the data, and Sect. 4 summarises the results obtained from our analysis. We discuss our results in Sect. 5 and present a brief summary in Sect. 6.
2. Sample
We use data from the Multi-Unit Spectroscopic Explorer (MUSE; Bacon et al. 2010), an integral field spectrograph installed on the Very Large Telescope (VLT) located at the Paranal Observatory in Chile. The spectral range is 4750 Å to 9300 Å, with a spectral resolution that ranges from 1700 for the blue wavelengths to 3400 for the red ones (Bacon et al. 2017; Guérou et al. 2017). This instrument offers a 1′×1′ field of view with 0.2″ per pixel in the wide field mode. These capabilities allow for the production of detailed maps in terms of spatial and velocity resolution, both crucial for the study of the kinematics of the inner structures of galaxies.
We selected four galaxies from the Time Inference with MUSE in Extragalactic Rings (TIMER) sample (Gadotti et al. 2019) of 24 barred nearby galaxies that present a wide range of star-forming rings. All TIMER galaxies are selected from the Spitzer Survey of Stellar Structure in Galaxies (S4G; Sheth et al. 2010) and are classified as strongly barred galaxies (SB, Buta et al. 2015). They also present high stellar masses, with values between 2.0 × 10¹⁰ M⊙ and 1.7 × 10¹¹ M⊙ (as estimated in Muñoz-Mateos et al. 2013, 2015; Querejeta et al. 2015) and low to intermediate inclinations (below 60°). The four selected galaxies were chosen to have a wide range of circumnuclear properties (e.g. the presence and size of a nuclear ring and the level of star formation).
NGC 1300 is an SB(rs)bc galaxy without nuclear activity (Scarlata et al. 2004). It is an archetypal example of a strongly barred galaxy and has been used in many studies related to the dynamical modelling of galaxies (e.g. Lindblad & Kristen 1996; Lindblad et al. 1997; Aguerri et al. 2000). While the presence of a nuclear ring is not evident given the smooth appearance of the stellar light in the inner regions (e.g. Pogge 1989; Pérez-Ramírez et al. 2000), Böker et al. (2008) found evidence of a nuclear ring of 400 pc radius (Comerón et al. 2010) traced by hot spots of Brγ and [Fe II] emission lines. These lines are related to the photo-ionised gas around OB stars and supernova remnants respectively, thus tracing the regions where star formation activity may be taking place.
NGC 5248 is classified as an SAB(rs)bc galaxy in the NASA/IPAC Extragalactic Database (NED)2, and it is a prime example of a grand-design spiral. There is a very active star-forming circumnuclear ring of 650 pc radius (Comerón et al. 2010) populated by numerous young star clusters (Maoz et al. 1996, 2001). Laine et al. (2001) and Maoz et al. (2001) detected a second small ring (of 150 pc radius; Comerón et al. 2010) inside the first one using Hα maps.
In addition to these two galaxies, we selected NGC 1097 and NGC 4643 as cases that better illustrate the extremes of high and low star formation activity, respectively, in the sample. Gadotti et al. (2019) also employed these two galaxies as examples of the wide range of properties that can be found in the TIMER sample, performing an analysis of the stellar kinematics, age, metallicity, and star formation history in the wavelength range between 4750 Å and 5500 Å. NGC 1097 is an SB(s)b galaxy and, like NGC 5248, is a very well-studied grand-design spiral. It also harbours a 1 kpc-radius (Comerón et al. 2010) nuclear ring, which has been observed in several ranges of the electromagnetic spectrum revealing the presence of numerous stellar clusters and a considerable amount of molecular gas (e.g. Prieto et al. 2019). NGC 4643 was added to our sample as a control galaxy. It is an SB(rs)0/a galaxy without a nuclear ring, which hosts little gas and in which the old component of the stellar population dominates the disc (Gadotti et al. 2019).
3. Analysis methods
We aim to derive the stellar kinematics from different spectral regions and explore any differences observed in velocity and velocity dispersion, as well as possible correlations with key parameters. The first step in this analysis is to select the appropriate wavelength regions that may be sensitive to, at least, extreme stellar populations (e.g. young and old). Following McDermid (2002), we used the Hβ and Mgb region (4750 − 5500 Å) and the Ca II Triplet region (8498 − 8950 Å) as proxies for young and old populations, respectively.
Hβ is particularly strong in absorption for stars with spectral type A. We thus assume that the kinematics derived from the spectral fitting around this line may be a good tracer of the kinematics of a relatively young stellar population. On the other hand, the Ca II Triplet is most prominent in absorption in G, K, and M type stars, tracing the old stellar population.
In our analysis we make use of the stellar population analysis from Bittner et al. (2020) obtained with the GIST pipeline3 (Bittner et al. 2019) that was applied to the entire TIMER sample. This analysis was performed imposing a level of Voronoi binning with a target signal-to-noise ratio of 100 per spectral pixel. The stellar kinematics (v⋆, σ⋆, h3, h4) and the stellar population parameters (e.g. luminosity-weighted age, metallicity [M/H], and [α/Fe]) were extracted from a specific wavelength range (from 4800 − 5800 Å). The MILES stellar population models (Falcón-Barroso et al. 2011; Vazdekis et al. 2015) were used as templates for the fitting.
Since we are interested in the kinematics of the two distinct spectral regions, we re-ran the GIST pipeline for the kinematics extraction for each of them separately. In this second analysis, we masked the emission lines that can affect the fitting process, like the Hβ line itself. In order to make our results easily comparable with those computed in the 4800 − 5800 Å wavelength range, we imposed the same Voronoi binning. While ideally it would be desirable to also extract the stellar population parameters from each spectral range, the Ca II Triplet region by itself is not sensitive enough to obtain reliable ages, metallicities, and [α/Fe] values. This is why we rely on the average values presented in Bittner et al. (2020), which are sensitive to the presence of young stellar populations. Besides the fitting in each spectral region, we performed an additional fitting for the whole spectral range in order to extract the colour excess E(B − V) from the binned spectra. In this second run we used the E-MILES models (Vazdekis et al. 2016) as templates, which are identical to the MILES models in the 4800 − 5800 Å region, but allow us to extend the analysis to the Ca II Triplet.
Three of the galaxies in our sample present well-defined nuclear rings characterised by the presence of young stars. NGC 4643 does not, is dominated by old stellar populations, and is used here as a control galaxy. Since we want to study specific relations between the kinematic and the stellar population parameters in different regimes, we have identified different regions of the galaxies with distinct properties. We use Hβ flux maps to help us define the nuclear ring-dominated areas. Regions outside those limits are denoted as the disc, while the area inside the ring is denoted as the nucleus (see Figs. 1 and 2). We note that we use only a portion of the MUSE field of view (FoV) for this analysis. This selection is done with the purpose of avoiding the noisy spaxels at the edges of the cubes and possible artefacts. The selected portion of the MUSE FoV covers an area of 17″ × 17″ in all the galaxies in the sample, with the exception of NGC 5248, where the area is slightly smaller (14″ × 14″).
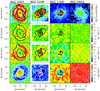 |
Fig. 1. Maps of kinematic and stellar population parameters for the four galaxies in our sample. Top row: Hβ emission-line fluxes in log scale. For NGC 1097, NGC 5248, and NGC 1300, we overlay the flux level that defines the nuclear ring. These isophotes are also indicated in the other panels for reference, but not in NGC 4643 since there is no evidence for a ring in this galaxy and it is used as a control galaxy. Second and third rows: maps of the difference in line-of-sight velocity and velocity dispersion between the two spectral ranges used in our study (i.e. Hβ−Ca II). Bottom row: maps for the mean luminosity-weighted age from the analysis performed by Bittner et al. (2020). |
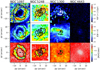 |
Fig. 2. Maps of dust extinction and stellar population parameters for the four galaxies in our sample. Each row (from top to bottom) presents: the fraction of young stars, colour excess E(B − V), and metallicity [M/H] (see text for details). Isophotes are plotted as indicated in Fig. 1. |
4. Results
We present our results for the three regions identified for the galaxies of our sample: disc, ring, and nucleus. The results are summarised in Table A.1 and include difference in line-of-sight velocity, difference in velocity dispersion, age, fraction of young stars, colour excess, metallicity, and colour.
4.1. Kinematic differences
The main result of our study is the kinematic difference between the two selected spectral ranges. The four galaxies selected from the TIMER sample illustrate scenarios where a young stellar population is present to different extents in the inner regions of the galaxies: from the extremely young inner disc of NGC 5248 to the lack of evidence of young stellar populations in the inner regions of NGC 4643. We now seek to confirm whether the young stars leave an imprint in the stellar kinematics, especially in the rings. Throughout the paper we refer to the differences in line-of-sight velocity between the two spectral ranges (young minus old) as Δv⋆, calculated as the absolute difference of the values of the estimated velocities for the Hβ and Ca II Triplet lines.
The maps in Fig. 1 present a fairly homogeneous and smooth appearance with the exception of NGC 1097 and some small regions in NGC 5248. In NGC 1097 we can clearly identify the shape of the ring, traced mostly by regions where the Δv⋆ values are high. This ring spans a wide range of Δv⋆ values, up to 70 km s−1, while in the disc and nucleus the maximum variation is about 25 km s−1. These differences are somewhat milder in the other three galaxies in our sample with mean values close to zero and a typical standard deviation of 5 km s−1. There are a few exceptions to this behaviour in specific locations in the disc of NGC 1300 and the ring of NGC 5248.
The presence of the rings stands out more when inspecting the differences in velocity dispersion (Δσ⋆ also computed as young minus old). This is most notable in NGC 1097 with mean Δσ⋆ values of 24 km s−1, well above the mean values observed in its disc and nucleus (∼10 km s−1 and ∼5 km s−1, respectively). For the other three galaxies, the scenario is analogous to what we observe for Δv⋆. It is worth noting the slightly positive mean overall value of Δσ⋆ observed in NGC 4643 (8 km s−1). Given the lack of young stellar populations the expectation is to find Δσ⋆ differences close to zero. If this was a problem due to the adopted spectral resolution as a function of wavelength in our analysis, one would expect a similar offset in equally old regions of other galaxies. This is however not observed when inspecting the disc dominated regions of NGC 1300, with populations similar to those in NGC 4346 but mean Δσ⋆ of 1 km s−1. With uncertainty levels for Δσ⋆ in our measurements of 9 km s−1 (see Pinna et al. 2019), it is difficult to draw firmer conclusions.
4.2. Age
Age is an excellent tracer of the presence of the rings in our sample. As expected, NGC 4643 is very different from the other three galaxies in the sample. In this galaxy there is no ring structure in the age map, which appears rather homogeneous. In NGC 4643 we find a rather old stellar population with a mean age around 11 Gyr with a small standard deviation of 0.7 Gyr.
In NGC 1097 and NGC 5248 we do not only find a well defined ring-like structure, but also relatively young stellar populations within them. This is especially noticeable in the ring of NGC 5248. In the two rings we estimate an average age below 4 Gyr (3.5 Gyr for NGC 1097 and 1.8 Gyr for NGC 5248). It is remarkable that in NGC 5248 we find a relatively small range of ages (from 0.5 Gyr to 5.0 Gyr) while in the ring of NGC 1097 it is much larger (from 0.8 Gyr to 10.7 Gyr), which clearly affects the obtained mean value. On the other hand, the ring of NGC 1300 seems to be dominated by an intermediate-age stellar population, with a mean age of 4.6 Gyr. The ages in all these rings correspond reasonably well with the ellipses we used to define them (see Sect. 3 for details).
The other two regions defined in these galaxies display different behaviours. NGC 1097 has a disc with a stellar population of intermediate age (≃6 Gyr) and a central region dominated by older stars (with mean age over 8 Gyr). In NGC 1300 the disc has an average age of 8.3 Gyr, while the region inside the ring has a slightly younger mean age of 5.9 Gyr with a smaller dispersion (0.7 Gyr for the central region and 1.6 Gyr for the disc). The whole disc of NGC 5248 is populated by young stars. The three defined regions are dominated by young stars with mean ages below 3 Gyr and a small dispersion which never exceeds 0.7 Gyr. All the age measurements agree well with the typical age uncertainties: around 0.5 Gyr and 3 Gyr for the young and old stellar population, respectively (Pinna et al. 2019).
4.3. Fraction of young stars
The fraction of young stars is recovered from the light-weighted results obtained by Bittner et al. (2020). We sum the weights applied during the fitting process to all the templates corresponding to stellar populations below a certain age, considering the models with ages below 2 Gyr as those tracing the young stellar populations. We checked that lowering this value to 1 Gyr gave consistent results.
The maps for the fraction of young stars (top row in Fig. 2) complete the information given by the age maps. NGC 4643 is characterised by a very homogeneous distribution of low values of the fraction of young stars, with a mean value close to zero and never exceeding 0.13. The other three galaxies illustrate different scenarios for the presence of a well defined ring. In the case of NGC 1097 the ring exhibits large regions dominated by high fractions of young stars, with a mean value of 0.44 with a dispersion of 0.22. In the disc we find similar values (mean value of 0.33 and a standard deviation of 0.18), while in the nucleus we find extremely low fractions with a mean value of 0.10 and a standard deviation of 0.10.
NGC 5248 shows high fractions of young stars in all the regions. The ring is recognisable by a greater presence of bins with high fractions of young stars, resulting in a slightly higher mean value, 0.63, when compared with the other two regions (0.53 and 0.55 for the disc and nucleus, respectively). In all the three regions the dispersion of values is small, around 0.15. In contrast, NGC 1300 exhibits rather low fractions in all the regions, with mean values of 0.09, 0.23, and 0.19 in disc, ring, and nucleus, respectively, and dispersion around 0.10. The typical uncertainty in our measurements of the fraction of young stars is 0.13.
4.4. Extinction
The maps of extinction, characterised by the colour excess E(B − V) (second row in Fig. 2), reveal a little more of the structure of the galaxies. These maps replicate and emphasise the information given by the colour maps in Gadotti et al. (2019). For NGC 1097 the E(B − V) map shows not only the presence of dust lanes in the ring, but also along the leading edge of the bar. In this galaxy we find a wide range of values of the colour excess in the three regions, resulting in discrete mean values in each one of them (0.08 in the disc, 0.16 in the ring, and 0.14 in the nucleus, all with low standard deviations around 0.05). In the map for NGC 1300 we also recognise these structures traced by higher values of E(B − V) when compared with those for the rest of the galaxy. Regarding the mean values in the three regions, NGC 1300 exhibits higher values compared to those in NGC 1097: 0.14 for the disc, 0.21 for the ring, and 0.20 for the nucleus, all with dispersion below 0.07. NGC 5248 is slightly different, with in general higher values of the colour excess. This gives us the image of a dusty galaxy, with plenty of star-forming regions. The ring is traced by alternating hot-spots of low and high values of the extinction, like in NGC 1097. For this galaxy the values in the three regions are very similar: 0.23 for the disc, 0.20 for the ring, and 0.22 for the nucleus. The E(B − V) map for NGC 4643 follows a similar pattern to the colour map obtained for this galaxy, presenting a patchy distribution of very low values (with a mean value around zero). All our measurements of the colour excess are expressed with an uncertainty of 0.05.
4.5. Metallicity
The metallicity also reproduces quite well the ring-like structure in all the galaxies of our sample (see the third row in Fig. 2). The only exception is NGC 4643 in which we find some structure, corresponding to the presence of a nuclear disc, but not a ring, with higher values in the central few hundred parsecs of the galaxy. We also see a band of intermediate and high values that goes from the south-west to the north-east part of the disc and which corresponds to the bar. In general we observe a rather homogeneous distribution around the mean value of −0.25 dex.
In NGC 1097 there is a clear match between the Hβ amplitude line contours used to define the ring and the regions with lower metallicities (ranging from −1.7 to 0.24 dex with an average value of −0.33). In the central region and the rest of the disc we find similar mean values of 0.15 and 0.04, respectively.
In NGC 1300 we report a similar match between regions with low metallicity and the isophotes obtained from the Hβ line amplitude map. For this galaxy we observe lower metallicity throughout the disc compared to the other galaxies in the sample. It is noticeable that for this galaxy the Hβ line isophotes used do not cover an important part of the ring. In these areas the metallicity reaches values similar to the central part of the galaxy (around 0). The mean value of the metallicity in the three regions is similar: −0.22 dex for the disc, −0.18 for the ring, and zero for the nucleus.
NGC 5248 also shows a correspondence between the peaks in the Hβ line amplitude map and the low metallicity regions, and, like in the case of NGC 1300, in the areas where the isophote is disrupted the metallicity reaches higher values, similar to the disc and the nuclear region. The mean values in the three regions defined (−0.09 in the disc, −0.21 in the ring, and 0.15 in the nucleus) are quite similar and also to the standard deviations in each region (0.15, 0.30, and 0.12 dex, respectively). The typical uncertainty in the measurements of the metallicity in all the galaxies in our sample is around 0.10 dex (Pinna et al. 2019).
5. Discussion
In light of the results obtained, we now wish to confirm which parameters depend on or influence the kinematics estimated in the spectral regions around the Hβ and Ca II Triplet lines. As mentioned above, we operate under the hypothesis that the kinematics derived using these spectral regions are sensitive to different stellar populations. We study the possible trends of the difference between the kinematics of young and old stellar populations with the various parameters extracted. We pay special attention to the behaviour of the rings, but also inspect trends in the disc and nucleus components.
5.1. Trends of the kinematic differences with stellar population properties
We start to explore the relation between the kinematic (velocity and velocity dispersion) differences of the two spectral regions studied and the stellar population properties extracted from our analysis. We first consider the nuclear ring regions.
Figure 3 and the corresponding figures in Appendix B show the differences in velocity (Δv⋆) and velocity dispersion (Δσ⋆) plotted against the values of mean age, fraction of young stars, metallicity, and colour excess. In order to make our analysis of the possible trends easier, we do not directly represent the whole clouds of points. We separate the results in each region of the galaxies in equally spaced bins for each parameter and estimate the mean value of the kinematical differences in each one of them. Additionally, for robustness, we ignore any bins with fewer than three elements. We study the significance of the mean value in each bin by comparing the 1σ confidence interval with the typical error in our estimations (calculated as the mean standard deviation of the errors of the difference in velocity and velocity dispersion, giving values of 7 km s−1 and 9 km s−1, respectively).
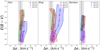 |
Fig. 3. Observed values of Δσ⋆ against colour excess E(B − V) in the three selected regions for the four galaxies in the sample. We represent the mean values of Δσ⋆ estimated in equally spaced age bins. We also represent the 1σ uncertainty interval for these mean values as colour-shaded regions. The typical error in the Δσ⋆ estimate is represented as the grey-shaded area. In general we find vertical distributions of the mean values of Δσ⋆. The only exception is the ring of NGC 1097 where we find increasing values of Δσ⋆ when E(B − V) increases. |
Examining the plots for Δv⋆ (see Figs. B.1–B.4), we find no significant trends in any of the regions, with the exception of Δv⋆ versus [M/H] where there is a tentative trend with metallicity in NGC 1097 and NGC 5248, the galaxies with the largest rings. The observed trend is such that high Δv⋆ values are found for lower metallicities. There is some evidence that the metal-poor stars in the ring of NGC 1097 are due to an interaction event with a nearby galaxy which has rejuvenated the ring (see Bittner et al. 2020, for details), a phenomenon which could explain this trend.
Regarding Δσ⋆, contrary to what one may expect, we do not observe clear trends with age or with the fraction of young stars (Figs. B.5 and B.6, respectively). The strongest relation seems to be with E(B − V). In Fig. 3 we show that there is a trend of Δσ⋆ with the colour excess, at least in the case of the ring of NGC 1097. There we find a clear trend of increasing values of Δσ⋆ with increasing colour excess. It is especially remarkable for the highest values of E(B − V), where we observe high values of the mean difference of velocity dispersion. These values are equivalent to several times the typical error. In the other galaxies and the other regions of NGC 1097 the mean values of Δσ⋆ in the colour excess bins are similar to the error. It is noticeable that the 1σ confidence intervals for the values of Δσ⋆ in the ring of NGC 1097 are slightly higher than the typical error. Nevertheless, we consider the Δσ⋆ measurements in the ring as robust as those in the other regions of NGC 1097 and the other galaxies in the sample. For the remaining parameters, we do not find clear trends (the relevant plots can be found in the appendix).
We do not find any significant relation of the kinematic differences with the extracted stellar population parameters in the cases of NGC 1300 and NGC 5248. We therefore will focus our attention on NGC 1097 and NGC 4643 only during the discussion, as they represent the two extreme cases of a very active ring on the one hand and a quiescent galaxy that does not exhibit any relevant kinematic difference on the other. The cases of NGC 1300 and NGC 5248 are presented in the appendix section instead.
Why do we see the trend in the ring in NGC 1097 and not in those in the other galaxies? We suggest that this is due to a beam-smearing effect, more pronounced in NGC 1300 and NGC 5248 than in NGC 1097. To confirm this, we re-ran the analysis of the data of NGC 1097 using the GIST pipeline at two different signal-to-noise ratios (S/N): 250 and 350. This change in the target S/N produces bigger Voronoi bin sizes and thus poorer spatial resolution. In the case of NGC 1097, for the considered field of view, at a S/N = 100 we obtain 3609 bins, at a S/N = 250, 540 bins, and at a S/N = 350, 264 bins. In contrast, for NGC 1300 at S/N = 100 we have 537 bins. Considering the distances for these two galaxies and a target S/N = 100, the average size of a bin located in the ring of NGC 1300 is about 39 pc, compared to around 22 pc in NGC 1097 (74 pc at S/N = 350). The effect of the change of the bin size on the ring of NGC 1097 can be seen in Fig. 4. There we show that increasing the bin size is translated into a loss of the higher values of the colour excess and a decrease in the higher values of Δσ⋆ of about 10 km s−1. We further discuss this in Appendix C.
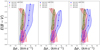 |
Fig. 4. Changes in Δσ⋆ with the E(B − V) distribution in the ring in NGC 1097. We plot the results for three different target S/N for the GIST pipeline analysis (the blue series): 100 (left panel), 250 (central panel), and 350 (right panel). We can observe how the highest values of the colour excess disappear when we increase the S/N. At the same time the highest values of Δσ⋆ start to decrease. At S/N = 350 we cannot clearly discern the trend we observe for S/N = 100 and the distribution for the ring of NGC 1097 is similar to that for that of NGC 5248. |
The main inconvenience with the way we present the trends in Figs. 3 and 4 is that the most extreme values get diluted when averaging in the bins in which we separate our results. An alternative method to present our results is to confront Δv⋆ and Δσ⋆ and colour-code the individual Voronoi bin values with different properties. The problem with this representation of the complete set of data is that for each range of values of the stellar population parameters we have a relatively large dispersion of the values of the kinematic differences. To aid the eye in identifying the main trends we have applied some smoothing using the LOESS4 package. This software is able to recover the trends in noisy data by applying a two-dimensional Locally Weighted Regression method (Cleveland & Devlin 1988). Results are presented in Figs. 5–8 for the whole data set of NGC 4643 and the three regions of NGC 1097. In order to illustrate the changes introduced by the smoothing process, in Appendix C we represent the original data in the left panel of each plot. We also account for the uncertainties introduced by the smoothing, estimating them as the standard deviation of the difference between the original and the smoothed data (as indicated in the caption of the figures).
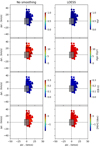 |
Fig. 5. Δσ⋆ against Δv⋆ with colour-coded values of the stellar population parameters (from top to bottom: fraction of young stars, mean age, colour excess, and metallicity) for NGC 4643. On the left side we represent the data with no smoothing and on the right side the LOESS-smoothed data. The grey rectangle represents the typical error in Δv⋆ (7 km s−1) and Δσ⋆ (9 km s−1). The uncertainties introduced by the smoothing are: ±0.019 for the YSF, ±0.7 Gyr for the mean age, ±0.016 for E(B − V), and ±0.08 dex for the metallicity. |
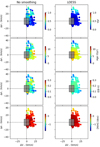 |
Fig. 6. Same as Fig. 5, now for the nucleus of NGC 1097. The uncertainties introduced by the smoothing are: ±0.10 for the YSF, ±1.7 Gyr for the mean age, ±0.06 for E(B − V), and ±0.10 dex for the metallicity. |
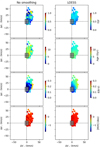 |
Fig. 7. Same as Fig. 5, now for the disc of NGC 1097. The uncertainties introduced by the smoothing are: ±0.17 for the YSF, ±1.4 Gyr for the mean age, ±0.04 for E(B − V), and ±0.010 dex for the metallicity. |
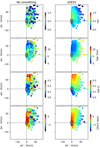 |
Fig. 8. Same as Fig. 5, now for the nuclear ring of NGC 1097. The uncertainties introduced by the smoothing are: ±0.20 for the YSF, ±1.6 Gyr for the mean age, ±0.05 for E(B − V), and ±0.36 dex for the metallicity. |
NGC 4643 (see Fig. 5) does not show any trend in the plots. The kinematic differences are clustered around low values, just a few times larger than the typical uncertainties. Regarding the values of the stellar population parameters, the dynamical ranges are small, with differences between the maximum and minimum values in general smaller than the estimated uncertainty.
The nucleus of NGC 1097 (see Fig. 6) presents a similar case to that of NGC 4643, spanning similar ranges of values. Its stellar population parameters show also relatively small dynamical ranges. There are some indications of weak trends, particularly of Δv⋆ with mean age. In the case of the disc (see Fig. 7) we find higher values of Δσ⋆, but low dynamical ranges of the parameters. There is a weak trend of Δv⋆ with colour excess, but the range of values of E(B − V) (0.04 − 0.2) is not large enough to be formally significant.
The ring of NGC 1097 (Fig. 8) exhibits larger kinematic differences between the two stellar populations. In general, all the stellar population parameters span wider ranges of values and trends of Δσ⋆ with mean age and E(B − V) are found. In the case of the trend with age there are indications of increasing Δσ⋆ with younger ages, but the range of mean ages spanned in this region (2 − 7 Gyr) is not large enough to confirm the trend. The picture with colour excess is quite different. We see a clear increase in Δσ⋆ with E(B − V), which spans a wide dynamic range (0.06 − 0.27). This results suggests that we may be probing different set of stars along the line-of-sight in the two spectral ranges, and this will contribute to the elevated Δσ⋆ values.
5.2. Kinematic simulations
When interpreting the results above, it is important to establish the expected level of kinematic differences caused by distinct populations alone (i.e. not influenced by the presence of dust). For that purpose, we have created a set of mock spectra made of young and old stellar populations with a wide range of kinematic properties. We designed the experiment to reproduce as closely as possible all the relevant details of the MUSE data, from the ranges used to the spectral resolution and sampling. We generated ∼48 000 test cases using the E-MILES library as the reference with the following input parameters: fraction of young stars (from 10−2 to 100 in 21 log-spaced steps), Ageyoung (with values of 0.1, 0.4, and 1.0 Gyr), Ageold (12.0 Gyr), [M/H]young (0.06 dex), [M/H]old (0.06 dex), Vyoung (from −100.0 to 100.0 in steps of 25 km s−1), Vold (from −100.0 to 100.0 in steps of 25 km s−1), σyoung (from 50.0 to 150.0 in steps of 50 km s−1), and σold (from 150.0 to 250.0 in steps of 50 km s−1).
For consistency, we fitted the data using the GIST pipeline with the same configurations as used with the real data. This included the masking of emission line-dominated regions, even though emission lines were not actually included in the mock spectra. Given the prominence of the Hβ line in the 4750−5500 Å region, we also performed a separate run without masking any parts of the spectra. The most relevant results of this experiment are presented in Fig. 9. Rather than presenting all the individual measurements, which are heavily dependent on our choice of input parameters for the simulations, we present the areas covering the 1%−99% percentiles of the output distributions as a function of the input parameter. They provide a good estimate of the range of possible solutions. These regions are denoted by the shaded areas in the different panels. The red areas correspond to the fits masking the Hβ line, while the blue ones are for fits where no pixels have been excluded.
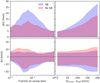 |
Fig. 9. Kinematic differences between the Hβ and Ca II triplet regions extracted from our simulations. Top panel: differences in velocity and velocity dispersion as a function of: (1) fraction of young stars and (2) input velocity difference between populations. Shaded areas mark the 1%−99% percentiles sampled by our simulations when the Hβ line is included (blue) or not (red) in the spectral fit. |
The first striking, but perhaps not surprising result of our simulations, is the lower sensitivity to differentiate between populations when the Hβ line is masked (i.e. as we find with real data). These differences are most notable in the velocity, and have a smaller effect in the velocity dispersion. This effect may explain the lack of trends observed with fraction of young stars in our MUSE data for all galaxies. The spread of most of the (red) solutions are also not much bigger than the typical uncertainty of our measurements (7 km s−1). Furthermore, the most extreme differences in velocity of ∼17 km s−1 are for situations where the differences in velocity between the two populations is of the order of 200 km s−1, which is highly unlikely to be the case in our galaxies.
Another interesting feature in Fig. 9 is the dependence of the kinematic differences on the fraction of young stars. When this fraction is either too small or too large, the resulting spectra are so dominated by old or young stars respectively that the differences are within the uncertainties of our measurements, and one effectively has a spectrum of a single stellar population. In our specific tests the largest differences are observed for intermediate fractions of young stars of around 5%, and again only for extreme differences in velocity of the input populations.
Our experiments confirm that with our particular setup for the kinematic extraction (i.e. masking the Hβ line), we should not observe strong trends with the fraction of young stars in the galaxies. The observed differences must thus be caused by dust extinction. This is an aspect that we cannot simulate without performing proper radiative transfer propagation to generate the input model spectra, which is well beyond the scope of this paper.
The most striking fact about our results is that we have positive values of the difference of velocity dispersion Δσ⋆ = σHβ − σCa II. This would mean, if we assume that the Hβ line is dominated by the young stars and the Ca Triplet by older ones, that we are observing a young stellar population with a higher velocity dispersion. This seems to contradict the intuitive idea of young stellar populations having a more ordered motion than the old stellar populations. The simulations above indicate that, at the spectral resolution of our data, differences in stellar populations is not the cause of the observed kinematic differences.
5.3. Asymmetric drift
The asymmetric drift va is one of the possible sources of an enhanced velocity dispersion in the kinematics traced by the Hβ line spectral region. It can be defined as the difference between the velocity of a hypothetical ensemble of stars vc, which moves around the centre of a galaxy in a perfectly circular orbit, and the mean rotation speed of the stellar population under study  . The asymmetric drift gives information about the tendency of a stellar population to lag behind other populations. The main reason for this lag can be found in the collisionless nature of the stars within a galaxy, which makes them sensitive to dynamical heating. In this kind of process the stars tend to migrate to orbits with larger radii, which leads to a decrease in the rotational velocity, as expected from angular momentum conservation. These changes are translated into an increase in the random motions of the stars and consequently an increase in the velocity dispersion of the stellar populations (Sellwood & Binney 2002). The more time passes, the more heating events will take place, thus it is expected to find higher velocity dispersions in old stellar populations (Walker et al. 1996).
Erroz-Ferrer et al. (2016) studied the slope of the inner rotation curves of a sample of spiral galaxies from the S4G survey, using Hα Fabry-Perot data to derive the rotation velocity of the ionised-gas component. They corrected these velocities for the asymmetric drift effect to obtain the circular velocity. While their results were estimated for ionised gas, they can nevertheless provide us with a reasonable approximation of the values we could expect for the stars.
When we evaluate the results of Erroz-Ferrer et al. (2016) at a radius of 650 pc, which is approximately the average radius of the rings of the galaxies in our sample, we obtain an asymmetric drift of around 2 km s−1. This value is very close to the average velocity differences estimated in the rings of our galaxies, but significantly smaller than the most extreme velocity differences estimated from our data. The asymmetric drift may thus have some relevance in the ring kinematics, especially concerning the velocity dispersion distribution, but it is not the main driver in those regions where we find the higher kinematic differences between the young and old stellar populations.
5.4. The effect of Paschen lines
Another possible effect that may be altering the kinematics estimated from the MUSE data is the presence of the Paschen line series in absorption in the Ca II Triplet region. The Paschen series fall in the near-infrared spectral range and some of the transitions overlap with the Ca II lines. We could expect to observe some dependence of this effect with age since the Paschen lines Pa 16, Pa 15 and Pa 13 are strong in young stars. This superposition could result in a change in the absorption lines shape, which will tend to increase the measured velocity dispersion (see, e.g. Fig. 10 in Vazdekis et al. 2003). Given that Δσ⋆ in the ring-dominated regions is such that velocity dispersions are larger in the Hβ region than around the Ca II Triplet, it is unlikely that the effect of the Paschen lines plays any significant role in our measurements.
6. Summary and conclusions
The goal of the present work is to explore the relation between the kinematics derived from the blue and red spectral ranges and the properties linked to different stellar populations harboured in the inner regions of four nearby galaxies in the TIMER sample. We derived the velocity and velocity dispersion around the Hβ and the Ca II Triplet spectral lines in these regions using the GIST pipeline. Additionally, we estimated the colour excess E(B − V). Assuming that the Hβ line is sensitive to the young stellar population and that the Ca II Triplet is dominated by the old stellar population, we analysed the correlation of the difference of velocity and velocity dispersion between both populations and the various other derived parameters. Our results can be summarised as follows:
-
The young stellar population presents not only a higher velocity, but also a higher velocity dispersion than the old stellar population. This is especially remarkable in the nuclear rings, where differences between both populations reach up to 70 ± 7 km s−1 in velocity and 88 ± 9 km s−1 velocity dispersion in the case of NGC 1097. Nevertheless, the mean values of the difference in velocity in the rings are low (below 10 km s−1), while the mean differences in velocity dispersion are more significant, reaching up to 24 ± 9 km s−1 in the most extreme case.
-
We observe a clear trend of the difference of velocity dispersion increasing with extinction in the ring of NGC 1097. This trend is also observed in the other rings, but is weaker there.
-
We demonstrate with the ring of NGC 1097 that the physical size of the bins plays a limited role in the change of the trend of Δσ⋆ with colour excess. Our study suggests that beam-smearing effects could be the reason for weaker trends in the rings of the other galaxies in our sample.
-
From a simulation exercise in which we mix a set of mock spectra of young and old stellar populations, we demonstrate that masking the Hβ line produces a lower sensitivity when determining differences in velocity and velocity dispersion. This explains the lack of trends with age or fraction of young stars.
-
We can rule out asymmetric drift or overlapping Paschen lines on top of the Ca II ones as drivers of the observed kinematic differences.
Our analysis indicates that the kinematic differences observed are not strongly related to the presence of different populations. However, the presence of dust and the physical size of the bins in our maps play important roles in the difference of velocity dispersion. We demonstrate that, in extreme situations, these differences are observable at the intermediate resolution offered by the current generation of IFUs, such as MUSE. In the near future, with the next generation of high-spectral resolution spectrographs (e.g. WEAVE; Dalton et al. 2018), it will be possible to perform even more detailed chemo-kinematic decompositions of nearby galaxies.
Available at Durham E-Theses http://etheses.dur.ac.uk/4179/
Acknowledgments
Based on observations collected at the European Southern Observatory under ESO programmes 097.B-0640(A). We acknowledge financial support from the European Union’s Horizon 2020 research and innovation programme under Marie Skłodowska-Curie grant agreement No 721463 to the SUNDIAL ITN network, from the State Research Agency (AEI) of the Spanish Ministry of Science and Innovation and the European Regional Development Fund (FEDER) under the grant with reference PID2019-105602GB-I00, and from IAC project P/300724, financed by the Ministry of Science and Innovation, through the State Budget and by the Canary Islands Department of Economy, Knowledge and Employment, through the Regional Budget of the Autonomous Community. JF-B acknowledges support from grants AYA2016-77237-C3-1-P and PID2019-107427GB-C32 of the Spanish Ministry of Science, Innovation and Universities (MCIU) and through the IAC project TRACES, which is partially supported by the state budget and the regional budget of the Consejería de Economía, Industria, Comercio y Conocimiento of the Canary Islands Autonomous Community. The Science, Technology and Facilities Council is acknowledged by JN for support through the Consolidated Grant Cosmology and Astrophysics at Portsmouth, ST/S000550/1. JMA acknowledge support from the MCIU by the grant AYA2017-83204-P and the Programa Operativo FEDER Andalucía 2014-2020 in collaboration with the Andalucian Office for Economy and Knowledge. PC acknowledges financial support from Fundação de Amparo à Pesquisa do Estado de São Paulo (FAPESP) process number 2018/05392-8 and Conselho Nacional de Desenvolvimento Científico e Tecnológico (CNPq) process number 310041/2018-0. GvdV acknowledges funding from the European Research Council (ERC) under the European Union’s Horizon 2020 research and innovation programme under grant agreement No 724857 (Consolidator Grant ArcheoDyn). TK was supported by the Basic Science Research Program through the National Research Foundation of Korea (NRF) funded by the Ministry of Education(No. 2019R1A6A3A01092024).
References
- Aguerri, J. A. L., Muñoz-Tuñón, C., Varela, A. M., & Prieto, M. 2000, A&A, 361, 841 [NASA ADS] [Google Scholar]
- Bacon, R., Copin, Y., Monnet, G., et al. 2001, MNRAS, 326, 23 [NASA ADS] [CrossRef] [Google Scholar]
- Bacon, R., Accardo, M., Adjali, L., et al. 2010, in The MUSE Second-generation VLT Instrument, SPIE Conf. Ser., 7735, 773508 [Google Scholar]
- Bacon, R., Conseil, S., Mary, D., et al. 2017, A&A, 608, A1 [NASA ADS] [CrossRef] [EDP Sciences] [Google Scholar]
- Baes, M., & Dejonghe, H. 2000, MNRAS, 313, 153 [NASA ADS] [CrossRef] [Google Scholar]
- Baes, M., Dejonghe, H., & De Rijcke, S. 2000, MNRAS, 318, 798 [CrossRef] [Google Scholar]
- Baes, M., Davies, J. I., Dejonghe, H., et al. 2003, MNRAS, 343, 1081 [NASA ADS] [CrossRef] [Google Scholar]
- Binney, J., & Merrifield, M. 1998, Galactic Astronomy (Princeton: Princeton University Press) [Google Scholar]
- Bittner, A., Falcón-Barroso, J., Nedelchev, B., et al. 2019, A&A, 628, A117 [NASA ADS] [CrossRef] [EDP Sciences] [Google Scholar]
- Bittner, A., Sánchez-Blázquez, P., Gadotti, D. A., et al. 2020, A&A, 643, A65 [CrossRef] [EDP Sciences] [Google Scholar]
- Böker, T., Falcón-Barroso, J., Schinnerer, E., Knapen, J. H., & Ryder, S. 2008, AJ, 135, 479 [NASA ADS] [CrossRef] [Google Scholar]
- Bonnet, H., Abuter, R., Baker, A., et al. 2004, The Messenger, 117, 17 [NASA ADS] [Google Scholar]
- Bosma, A., Byun, Y., Freeman, K. C., & Athanassoula, E. 1992, ApJ, 400, L21 [NASA ADS] [CrossRef] [Google Scholar]
- Bruzual, G., & Charlot, S. 2003, MNRAS, 344, 1000 [NASA ADS] [CrossRef] [Google Scholar]
- Bundy, K., Bershady, M. A., Law, D. R., et al. 2015, ApJ, 798, 7 [NASA ADS] [CrossRef] [Google Scholar]
- Buta, R., & Combes, F. 1996, Fund. Cosm. Phys., 17, 95 [Google Scholar]
- Buta, R. J., Sheth, K., Athanassoula, E., et al. 2015, ApJS, 217, 32 [NASA ADS] [CrossRef] [Google Scholar]
- Cappellari, M., Emsellem, E., Krajnović, D., et al. 2011, MNRAS, 413, 813 [NASA ADS] [CrossRef] [Google Scholar]
- Carrasco, E., Gil de Paz, A., Gallego, J., et al. 2018, in Society of Photo-Optical Instrumentation Engineers (SPIE) Conference Series, Proc. SPIE, 10702, 1070216 [Google Scholar]
- Chilingarian, I., Prugniel, P., Sil’Chenko, O., & Koleva, M. 2007, in Stellar Populations as Building Blocks of Galaxies, eds. A. Vazdekis, & R. Peletier, IAU Symp., 241, 175 [Google Scholar]
- Cleveland, W. S., & Devlin, S. J. 1988, J. Am. Stat. Assoc., 83, 596 [CrossRef] [Google Scholar]
- Coccato, L., Morelli, L., Pizzella, A., et al. 2013, A&A, 549, A3 [NASA ADS] [CrossRef] [EDP Sciences] [Google Scholar]
- Combes, F., & Gerin, M. 1985, A&A, 150, 327 [NASA ADS] [Google Scholar]
- Combes, F., & Sanders, R. H. 1981, A&A, 96, 164 [NASA ADS] [Google Scholar]
- Comerón, S., Knapen, J. H., Beckman, J. E., et al. 2010, MNRAS, 402, 2462 [NASA ADS] [CrossRef] [Google Scholar]
- Croom, S. M., Lawrence, J. S., Bland-Hawthorn, J., et al. 2012, MNRAS, 421, 872 [NASA ADS] [Google Scholar]
- Dalton, G., Trager, S., Abrams, D. C., et al. 2018, in Ground-based and Airborne Instrumentation for Astronomy VII, SPIE Conf. Ser., 10702, 107021B [Google Scholar]
- Davies, J. I. 1990, MNRAS, 245, 350 [Google Scholar]
- Eisenhauer, F., Abuter, R., Bickert, K., et al. 2003, in SINFONI – Integral Field Spectroscopy at 50 Milli-arcsecond Resolution with the ESO VLT, eds. M. Iye, & A. F. M. Moorwood, SPIE Conf. Ser., 4841, 1548 [Google Scholar]
- Erroz-Ferrer, S., Knapen, J. H., Leaman, R., et al. 2016, MNRAS, 458, 1199 [NASA ADS] [CrossRef] [Google Scholar]
- Fabricius, M. H., Barnes, S., Bender, R., et al. 2008, in Ground-based and Airborne Instrumentation for Astronomy II, SPIE Conf. Ser., 7014, 701473 [CrossRef] [Google Scholar]
- Falcón-Barroso, J., Bacon, R., Bureau, M., et al. 2006, MNRAS, 369, 529 [Google Scholar]
- Falcón-Barroso, J., Sánchez-Blázquez, P., Vazdekis, A., et al. 2011, A&A, 532, A95 [NASA ADS] [CrossRef] [EDP Sciences] [Google Scholar]
- Gadotti, D. A., Seidel, M. K., Sánchez-Blázquez, P., et al. 2015, A&A, 584, A90 [NASA ADS] [CrossRef] [EDP Sciences] [Google Scholar]
- Gadotti, D. A., Sánchez-Blázquez, P., Falcón-Barroso, J., et al. 2019, MNRAS, 482, 506 [Google Scholar]
- Gil de Paz, A., Gallego, J., Carrasco, E., et al. 2014, in Society of Photo-Optical Instrumentation Engineers (SPIE) Conference Series, Proc. SPIE, 9147, 91470O [Google Scholar]
- Gil de Paz, A., Carrasco, E., Gallego, J., et al. 2018, in Society of Photo-Optical Instrumentation Engineers (SPIE) Conference Series, Proc. SPIE, 10702, 1070217 [Google Scholar]
- Guérou, A., Krajnović, D., Epinat, B., et al. 2017, A&A, 608, A5 [NASA ADS] [CrossRef] [EDP Sciences] [Google Scholar]
- Johnston, E. J., Merrifield, M. R., Aragón-Salamanca, A., & Cappellari, M. 2013, MNRAS, 428, 1296 [NASA ADS] [CrossRef] [Google Scholar]
- Johnston, E. J., Häußler, B., Aragón-Salamanca, A., et al. 2017, MNRAS, 465, 2317 [Google Scholar]
- Johnston, E. J., Merrifield, M., & Aragón-Salamanca, A. 2018a, MNRAS, 478, 4255 [CrossRef] [Google Scholar]
- Johnston, E. J., Hau, G. K. T., Coccato, L., & Herrera, C. 2018b, MNRAS, 480, 3215 [NASA ADS] [CrossRef] [Google Scholar]
- Kelz, A., Verheijen, M. A. W., Roth, M. M., et al. 2006, PASP, 118, 129 [NASA ADS] [CrossRef] [Google Scholar]
- Knapen, J. H., Beckman, J. E., Heller, C. H., Shlosman, I., & de Jong, R. S. 1995, ApJ, 454, 623 [NASA ADS] [CrossRef] [Google Scholar]
- Kormendy, J. 1979, ApJ, 227, 714 [NASA ADS] [CrossRef] [Google Scholar]
- Kormendy, J. 2013, in Secular Evolution in Disk Galaxies, eds. J. Falcón-Barroso, & J. H. Knapen, 1 [Google Scholar]
- Kormendy, J., & Kennicutt, R. C., Jr. 2004, ARA&A, 42, 603 [NASA ADS] [CrossRef] [Google Scholar]
- Laine, S., Knapen, J. H., Pérez-Ramírez, D., Englmaier, P., & Matthias, M. 2001, MNRAS, 324, 891 [NASA ADS] [CrossRef] [Google Scholar]
- Le Fèvre, O., Saisse, M., Mancini, D., et al. 2003, in Society of Photo-Optical Instrumentation Engineers (SPIE) Conference Series, eds. M. Iye, & A. F. M. Moorwood, Proc. SPIE, 4841, 1670 [Google Scholar]
- Lindblad, P. A. B., & Kristen, H. 1996, A&A, 313, 733 [NASA ADS] [Google Scholar]
- Lindblad, P. A. B., Kristen, H., Joersaeter, S., & Hoegbom, J. 1997, A&A, 317, 36 [NASA ADS] [Google Scholar]
- Maoz, D., Barth, A. J., Sternberg, A., et al. 1996, AJ, 111, 2248 [NASA ADS] [CrossRef] [Google Scholar]
- Maoz, D., Barth, A. J., Ho, L. C., Sternberg, A., & Filippenko, A. V. 2001, AJ, 121, 3048 [NASA ADS] [CrossRef] [Google Scholar]
- Matthews, L. D., & Wood, K. 2001, ApJ, 548, 150 [NASA ADS] [CrossRef] [Google Scholar]
- McDermid, R. M. 2002, PhD Thesis, Durham University, UK [Google Scholar]
- Muñoz-Mateos, J. C., Sheth, K., Gil de Paz, A., et al. 2013, ApJ, 771, 59 [NASA ADS] [CrossRef] [Google Scholar]
- Muñoz-Mateos, J. C., Sheth, K., Regan, M., et al. 2015, ApJS, 219, 3 [Google Scholar]
- Méndez-Abreu, J., Sánchez, S. F., & de Lorenzo-Cáceres, A. 2019a, MNRAS, 484, 4298 [Google Scholar]
- Méndez-Abreu, J., Sánchez, S. F., & de Lorenzo-Cáceres, A. 2019b, MNRAS, 488, L80 [NASA ADS] [CrossRef] [Google Scholar]
- Ocvirk, P., Pichon, C., Lançon, A., & Thiébaut, E. 2006, MNRAS, 365, 74 [Google Scholar]
- Paturel, G., Petit, C., Prugniel, P., et al. 2003, A&A, 412, 45 [NASA ADS] [CrossRef] [EDP Sciences] [Google Scholar]
- Pérez-Ramírez, D., Knapen, J. H., Peletier, R. F., et al. 2000, MNRAS, 317, 234 [NASA ADS] [CrossRef] [Google Scholar]
- Pillepich, A., Springel, V., Nelson, D., et al. 2018, MNRAS, 473, 4077 [Google Scholar]
- Piner, B. G., Stone, J. M., & Teuben, P. J. 1995, ApJ, 449, 508 [NASA ADS] [CrossRef] [Google Scholar]
- Pinna, F., Falcón-Barroso, J., Martig, M., et al. 2019, A&A, 623, A19 [NASA ADS] [CrossRef] [EDP Sciences] [Google Scholar]
- Pogge, R. W. 1989, ApJS, 71, 433 [NASA ADS] [CrossRef] [Google Scholar]
- Prieto, M. A., Fernandez-Ontiveros, J. A., Bruzual, G., et al. 2019, MNRAS, 485, 3264 [CrossRef] [Google Scholar]
- Querejeta, M., Meidt, S. E., Schinnerer, E., et al. 2015, ApJS, 219, 5 [NASA ADS] [CrossRef] [Google Scholar]
- Rautiainen, P., & Salo, H. 2000, A&A, 362, 465 [NASA ADS] [Google Scholar]
- Regan, M. W., & Teuben, P. J. 2004, ApJ, 600, 595 [NASA ADS] [CrossRef] [Google Scholar]
- Roth, M. M., Kelz, A., Fechner, T., et al. 2005, PASP, 117, 620 [NASA ADS] [CrossRef] [Google Scholar]
- Sakamoto, K., Okumura, S. K., Ishizuki, S., & Scoville, N. Z. 1999, ApJ, 525, 691 [NASA ADS] [CrossRef] [Google Scholar]
- Sánchez, S. F., García-Benito, R., Zibetti, S., et al. 2016, A&A, 594, A36 [NASA ADS] [CrossRef] [EDP Sciences] [Google Scholar]
- Scarlata, C., Stiavelli, M., Hughes, M. A., et al. 2004, AJ, 128, 1124 [NASA ADS] [CrossRef] [Google Scholar]
- Schaye, J., Crain, R. A., Bower, R. G., et al. 2015, MNRAS, 446, 521 [Google Scholar]
- Sellwood, J. A., & Binney, J. J. 2002, MNRAS, 336, 785 [NASA ADS] [CrossRef] [Google Scholar]
- Sheth, K., Vogel, S. N., Regan, M. W., Thornley, M. D., & Teuben, P. J. 2005, ApJ, 632, 217 [NASA ADS] [CrossRef] [Google Scholar]
- Sheth, K., Regan, M., Hinz, J. L., et al. 2010, PASP, 122, 1397 [NASA ADS] [CrossRef] [Google Scholar]
- Sheth, K., Melbourne, J., Elmegreen, D. M., et al. 2012, ApJ, 758, 136 [NASA ADS] [CrossRef] [Google Scholar]
- Shlosman, I., Frank, J., & Begelman, M. C. 1989, Nature, 338, 45 [NASA ADS] [CrossRef] [Google Scholar]
- Sormani, M. C., Binney, J., & Magorrian, J. 2015, MNRAS, 449, 2421 [NASA ADS] [CrossRef] [Google Scholar]
- Tabor, M., Merrifield, M., Aragón-Salamanca, A., et al. 2017, MNRAS, 466, 2024 [NASA ADS] [CrossRef] [Google Scholar]
- Tabor, M., Merrifield, M., Aragón-Salamanca, A., et al. 2019, MNRAS, 485, 1546 [CrossRef] [Google Scholar]
- Vazdekis, A. 1999, ApJ, 513, 224 [NASA ADS] [CrossRef] [Google Scholar]
- Vazdekis, A., Cenarro, A. J., Gorgas, J., Cardiel, N., & Peletier, R. F. 2003, MNRAS, 340, 1317 [NASA ADS] [CrossRef] [Google Scholar]
- Vazdekis, A., Sánchez-Blázquez, P., Falcón-Barroso, J., et al. 2010, MNRAS, 404, 1639 [NASA ADS] [Google Scholar]
- Vazdekis, A., Coelho, P., Cassisi, S., et al. 2015, MNRAS, 449, 1177 [NASA ADS] [CrossRef] [Google Scholar]
- Vazdekis, A., Koleva, M., Ricciardelli, E., Röck, B., & Falcón-Barroso, J. 2016, MNRAS, 463, 3409 [Google Scholar]
- Verheijen, M. A. W., Bershady, M. A., Andersen, D. R., et al. 2004, Astron. Nachr., 325, 151 [NASA ADS] [CrossRef] [Google Scholar]
- Walker, I. R., Mihos, J. C., & Hernquist, L. 1996, ApJ, 460, 121 [NASA ADS] [CrossRef] [Google Scholar]
Appendix A: Parameter values in each region
In this section we present the ranges, mean values, and dispersions of the kinematics and stellar population parameters extracted during our analysis in the three regions studied in the galaxies of our sample. The typical uncertainty for Δv⋆ is 7 km s−1, for Δσ⋆ 9 km s−1, between 0.5 Gyr (for the young stellar populations) and 3 Gyr (for the old stellar populations; Pinna et al. 2019) for mean age, for the fraction of young stars 0.13, for the colour excess 0.05, and for [M/H] 0.10 dex (Pinna et al. 2019).
Ranges, means, and dispersions of the kinematics and stellar population parameters extracted in our analysis in the three regions studied in our galaxies.
Appendix B: Kinematic differences against stellar population parameters
In the present section we show the possible trends of the kinematic differences between the two selected spectral regions against the stellar population parameters extracted during our analysis. In these plots we separate our results in each region of the galaxies in equally spaced bins for each stellar parameter and estimate the mean value of both the difference in velocity Δv⋆ and the difference in velocity dispersion Δσ⋆ in each one of them. The significance of each mean value is analysed by comparing the 1σ confidence interval (represented as a colour-shaded area) with the typical error in our kinematic estimations, 7 km s−1 for Δv⋆ and 9 km s−1 for Δσ⋆ (represented as a grey-shaded area).
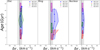 |
Fig. B.1. Observed values of the difference in blue-red velocities, Δv⋆, against age in the three selected regions for the four galaxies in the sample. We do not observe any trends of Δv⋆ with age, except in the case of the ring in NGC 1097, where the velocity traced by the Ca II triplet seems to increase with increasing mean ages. Nevertheless, the mean Δv⋆ value in each bin is in most of the cases not bigger than the typical error. Thus, we conclude that this correlation is not significant. In the case of the other three galaxies we still not observing any trend. |
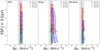 |
Fig. B.2. Same as Fig. B.1, now for Δv⋆ against the fraction of young stars. The scenario is similar to that for the age: we do not have any trends in the discs and nuclei of the four galaxies, which present almost vertical distributions. In the case of the rings we find increasing values of the difference in velocity with increasing values of the fraction of young stars for NGC 1097, but similarly to what happened with age, the trend is not reliable since the mean values of Δv⋆ are comparable to the typical error. For the other rings we do not observe any clear trend. |
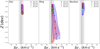 |
Fig. B.3. Same ass Fig. B.1, now for Δv⋆ against metallicity [M/H]. The discs and nuclei of the four galaxies span a very small range which complicates the observation of the possible trends. Regarding the rings, only NGC 1097 and NGC 5248 span a wide range of values of the metallicity. However, they do not present a clear trend and in most of the bins the mean value of Δv⋆ is not bigger than the typical error. |
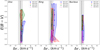 |
Fig. B.4. Same as Fig. B.1, now for Δv⋆ against colour excess E(B − V). In general we observe in the three regions of each galaxy almost vertical distributions. The only exception is the disc in NGC 1097 which present increasing values of Δv⋆ with increasing values of E(B − V). Nevertheless, as we previously stated for other parameters, the trend is not reliable since the mean values of Δv⋆ in each bin are comparable to the value of the typical error. |
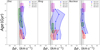 |
Fig. B.5. Same as Fig. B.1, now for Δσ⋆ against age. In general we argue that the three regions of each galaxy span little age range, which hinder the study of possible trends. The only exceptions are the three regions of NGC 1097 and the disc of NGC 1300. In the cases of the disc in NGC 1300 and the disc and nucleus in NGC 1097 we find vertical distributions, indicating the absence of any trend. For the ring in NGC 1097 we observe high mean values of Δσ⋆ when compared with the typical error, but we do not find a clear distribution pattern, in addition to the fact that they present wide 1σ uncertainty intervals. |
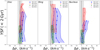 |
Fig. B.6. Same as Fig. B.1, now for Δσ⋆ against the fraction of young stars. Similarly to the case of Δv⋆ against the fraction of young stars we find almost vertical distributions of the mean values of Δσ⋆ in all the regions of each galaxy. The only exception is the nucleus in NGC 1097 where we find a slight trend of increasing velocity dispersion differences with increasing fractions, but we find mean values of Δσ⋆ very similar to the typical error. Thus, we rule out any kind of trend with the fraction of young stars. |
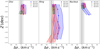 |
Fig. B.7. Same as Fig. B.1, now for Δσ⋆ against metallicity [M/H]. In the cases of the discs and nuclei of the whole sample we find not enough bins to discern a clear trend. The rings in NGC 1097 and NGC 5248 span a wide range of values of the metallicity, but they present a vertical distribution of the mean values of Δσ⋆, indicating the absence of a trend. |
Appendix C: Kinematic differences in NGC 1300 and NGC 5248
Although NGC 1300 and NGC 5248 do not show clear trends of the differences in kinematics with the stellar population parameters, it is still interesting to look for possible trends. In this sense the representation of the whole set of data in each regions can provide us with valuable information.
All three regions in NGC 1300 (see Fig. C.1 for the disc, Fig. C.2 for the ring, and Fig. C.3 for the nucleus) exhibit rather low values of Δv⋆ and Δσ⋆, close to the values of the typical uncertainties. We find that the dynamical ranges are quite small and comparable to the uncertainties in most of the cases. However, we glimpse trends of Δσ⋆ with mean age in the disc and with colour excess in the disc and ring. In all cases the range of values is small, especially in the case of mean age.
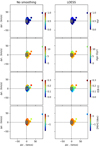 |
Fig. C.1. Δσ⋆ against Δv⋆ with colour-coded values of the stellar population parameters (from top to bottom: fraction of young stars, mean age, colour excess, and metallicity) for the disc in NGC 1300. On the left side we represent the data with no smoothing and on the right side the LOESS-smoothed data. The grey rectangle represents the typical error in Δv⋆ (7 km s−1) and Δσ⋆ (9 km s−1). The uncertainties introduced by the smoothing are: ±0.11 for the YSF, ±1.4 Gyr for the mean age, ±0.05 for E(B − V), and ±0.07 dex for the metallicity. |
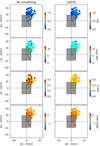 |
Fig. C.2. Same as Fig. C.1, now for the ring in NGC 1300. The uncertainties introduced by the smoothing are: ±0.11 for the YSF, ±0.7 Gyr for the mean age, ±0.04 for E(B − V), and ±0.10 dex for the metallicity. |
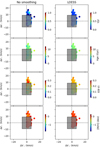 |
Fig. C.3. Same as Fig. C.1, now for the nucleus in NGC 1300. The uncertainties introduced by the smoothing are: ±0.08 for the YSF, ±0.6 Gyr for the mean age, ±0.03 for E(B − V), and ±0.08 dex for the metallicity. |
The case of NGC 5248 (see Fig. C.4 for the disc, Fig. C.5 for the ring, and Fig. C.6 for the nucleus) is slightly different. Here Δv⋆ and Δσ⋆ span wider ranges of values. On the other hand, most of the stellar population parameters show small ranges. In the case of the ring we discern a correlation of Δσ⋆ with colour excess which is similar but not as strong as the one in NGC 1097.
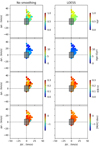 |
Fig. C.4. Same as Fig. C.1, now for the disc in NGC 5248. The uncertainties introduced by the smoothing are: ±0.14 for the YSF, ±0.6 Gyr for the mean age, ±0.03 for E(B − V), and ±0.14 dex for the metallicity. |
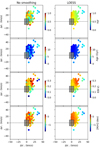 |
Fig. C.5. Same as Fig. C.1, now for the ring in NGC 5248. The uncertainties introduced by the smoothing are: ±0.14 for the YSF, ±0.7 Gyr for the mean age, ±0.05 for E(B − V), and ±0.3 dex for the metallicity. |
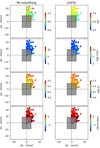 |
Fig. C.6. Same as Fig. C.1, now for the nucleus in NGC 5248. The uncertainties introduced by the smoothing are: ±0.14 for the YSF, ±0.6 Gyr for the mean age, ±0.03 for E(B − V), and ±0.10 dex for the metallicity. |
In Figs. C.7 and C.8 we plot the complete cloud of points corresponding to the analysis of the ring of NGC 1097 at target signal-to-noise ratios of 250 and 350, respectively. These changes in the S/N are translated into changes in the average size of the bins in the ring. Considering a distance of 15.2 Mpc (Paturel et al. 2003) we have bin sizes of 22 pc at S/N = 100, 63 pc at S/N = 250, and 73 pc at S/N = 350. We see how the kinematic differences decrease as the S/N is increased. Specifically, the ranges in Δv⋆ and Δσ⋆ are around 50% and 40% smaller at S/N = 350 than at S/N = 100, respectively.
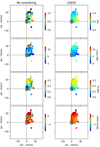 |
Fig. C.7. Same as Fig. C.1, now for the ring in NGC 1097 with a binning level at a target S/N of 250. The uncertainties introduced by the smoothing are: ±0.23 for the YSF, ±2.3 Gyr for the mean age, ±0.05 for E(B − V), and ±0.35 dex for the metallicity. |
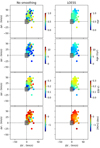 |
Fig. C.8. Same as Fig. C.1, now for the ring in NGC 1097 with a binning level at a target S/N of 350. The uncertainties introduced by the smoothing are: ±0.21 for the YSF, ±1.9 Gyr for the mean age, ±0.07 for E(B − V), and ±0.3 dex for the metallicity. |
In the rings of NGC 1300 and NGC 5248, at S/N = 100, we have average bin sizes of 39 pc and 35 pc, at distances of 20.2 Mpc and 17.9 Mpc (Paturel et al. 2003). This means that we will be losing the extreme values in the rings of these galaxies, similarly to what happens when the bin size is increased in NGC 1097.
The size of the bin thus plays some role in the prevalence of the extreme values of the kinematic differences. The current generation of IFUs is able to detect these values even at reasonable levels of S/N. It is likely that the next generation of IFUs, like VIRUS-W (Fabricius et al. 2008), MEGARA (Gil de Paz et al. 2018), or WEAVE-LIFU (Dalton et al. 2018), will produce data with enough resolution to properly separate different stellar populations.
All Tables
Ranges, means, and dispersions of the kinematics and stellar population parameters extracted in our analysis in the three regions studied in our galaxies.
All Figures
|
Fig. 1. Maps of kinematic and stellar population parameters for the four galaxies in our sample. Top row: Hβ emission-line fluxes in log scale. For NGC 1097, NGC 5248, and NGC 1300, we overlay the flux level that defines the nuclear ring. These isophotes are also indicated in the other panels for reference, but not in NGC 4643 since there is no evidence for a ring in this galaxy and it is used as a control galaxy. Second and third rows: maps of the difference in line-of-sight velocity and velocity dispersion between the two spectral ranges used in our study (i.e. Hβ−Ca II). Bottom row: maps for the mean luminosity-weighted age from the analysis performed by Bittner et al. (2020). |
| In the text | |
|
Fig. 2. Maps of dust extinction and stellar population parameters for the four galaxies in our sample. Each row (from top to bottom) presents: the fraction of young stars, colour excess E(B − V), and metallicity [M/H] (see text for details). Isophotes are plotted as indicated in Fig. 1. |
| In the text | |
|
Fig. 3. Observed values of Δσ⋆ against colour excess E(B − V) in the three selected regions for the four galaxies in the sample. We represent the mean values of Δσ⋆ estimated in equally spaced age bins. We also represent the 1σ uncertainty interval for these mean values as colour-shaded regions. The typical error in the Δσ⋆ estimate is represented as the grey-shaded area. In general we find vertical distributions of the mean values of Δσ⋆. The only exception is the ring of NGC 1097 where we find increasing values of Δσ⋆ when E(B − V) increases. |
| In the text | |
|
Fig. 4. Changes in Δσ⋆ with the E(B − V) distribution in the ring in NGC 1097. We plot the results for three different target S/N for the GIST pipeline analysis (the blue series): 100 (left panel), 250 (central panel), and 350 (right panel). We can observe how the highest values of the colour excess disappear when we increase the S/N. At the same time the highest values of Δσ⋆ start to decrease. At S/N = 350 we cannot clearly discern the trend we observe for S/N = 100 and the distribution for the ring of NGC 1097 is similar to that for that of NGC 5248. |
| In the text | |
|
Fig. 5. Δσ⋆ against Δv⋆ with colour-coded values of the stellar population parameters (from top to bottom: fraction of young stars, mean age, colour excess, and metallicity) for NGC 4643. On the left side we represent the data with no smoothing and on the right side the LOESS-smoothed data. The grey rectangle represents the typical error in Δv⋆ (7 km s−1) and Δσ⋆ (9 km s−1). The uncertainties introduced by the smoothing are: ±0.019 for the YSF, ±0.7 Gyr for the mean age, ±0.016 for E(B − V), and ±0.08 dex for the metallicity. |
| In the text | |
|
Fig. 6. Same as Fig. 5, now for the nucleus of NGC 1097. The uncertainties introduced by the smoothing are: ±0.10 for the YSF, ±1.7 Gyr for the mean age, ±0.06 for E(B − V), and ±0.10 dex for the metallicity. |
| In the text | |
|
Fig. 7. Same as Fig. 5, now for the disc of NGC 1097. The uncertainties introduced by the smoothing are: ±0.17 for the YSF, ±1.4 Gyr for the mean age, ±0.04 for E(B − V), and ±0.010 dex for the metallicity. |
| In the text | |
|
Fig. 8. Same as Fig. 5, now for the nuclear ring of NGC 1097. The uncertainties introduced by the smoothing are: ±0.20 for the YSF, ±1.6 Gyr for the mean age, ±0.05 for E(B − V), and ±0.36 dex for the metallicity. |
| In the text | |
|
Fig. 9. Kinematic differences between the Hβ and Ca II triplet regions extracted from our simulations. Top panel: differences in velocity and velocity dispersion as a function of: (1) fraction of young stars and (2) input velocity difference between populations. Shaded areas mark the 1%−99% percentiles sampled by our simulations when the Hβ line is included (blue) or not (red) in the spectral fit. |
| In the text | |
|
Fig. B.1. Observed values of the difference in blue-red velocities, Δv⋆, against age in the three selected regions for the four galaxies in the sample. We do not observe any trends of Δv⋆ with age, except in the case of the ring in NGC 1097, where the velocity traced by the Ca II triplet seems to increase with increasing mean ages. Nevertheless, the mean Δv⋆ value in each bin is in most of the cases not bigger than the typical error. Thus, we conclude that this correlation is not significant. In the case of the other three galaxies we still not observing any trend. |
| In the text | |
|
Fig. B.2. Same as Fig. B.1, now for Δv⋆ against the fraction of young stars. The scenario is similar to that for the age: we do not have any trends in the discs and nuclei of the four galaxies, which present almost vertical distributions. In the case of the rings we find increasing values of the difference in velocity with increasing values of the fraction of young stars for NGC 1097, but similarly to what happened with age, the trend is not reliable since the mean values of Δv⋆ are comparable to the typical error. For the other rings we do not observe any clear trend. |
| In the text | |
|
Fig. B.3. Same ass Fig. B.1, now for Δv⋆ against metallicity [M/H]. The discs and nuclei of the four galaxies span a very small range which complicates the observation of the possible trends. Regarding the rings, only NGC 1097 and NGC 5248 span a wide range of values of the metallicity. However, they do not present a clear trend and in most of the bins the mean value of Δv⋆ is not bigger than the typical error. |
| In the text | |
|
Fig. B.4. Same as Fig. B.1, now for Δv⋆ against colour excess E(B − V). In general we observe in the three regions of each galaxy almost vertical distributions. The only exception is the disc in NGC 1097 which present increasing values of Δv⋆ with increasing values of E(B − V). Nevertheless, as we previously stated for other parameters, the trend is not reliable since the mean values of Δv⋆ in each bin are comparable to the value of the typical error. |
| In the text | |
|
Fig. B.5. Same as Fig. B.1, now for Δσ⋆ against age. In general we argue that the three regions of each galaxy span little age range, which hinder the study of possible trends. The only exceptions are the three regions of NGC 1097 and the disc of NGC 1300. In the cases of the disc in NGC 1300 and the disc and nucleus in NGC 1097 we find vertical distributions, indicating the absence of any trend. For the ring in NGC 1097 we observe high mean values of Δσ⋆ when compared with the typical error, but we do not find a clear distribution pattern, in addition to the fact that they present wide 1σ uncertainty intervals. |
| In the text | |
|
Fig. B.6. Same as Fig. B.1, now for Δσ⋆ against the fraction of young stars. Similarly to the case of Δv⋆ against the fraction of young stars we find almost vertical distributions of the mean values of Δσ⋆ in all the regions of each galaxy. The only exception is the nucleus in NGC 1097 where we find a slight trend of increasing velocity dispersion differences with increasing fractions, but we find mean values of Δσ⋆ very similar to the typical error. Thus, we rule out any kind of trend with the fraction of young stars. |
| In the text | |
|
Fig. B.7. Same as Fig. B.1, now for Δσ⋆ against metallicity [M/H]. In the cases of the discs and nuclei of the whole sample we find not enough bins to discern a clear trend. The rings in NGC 1097 and NGC 5248 span a wide range of values of the metallicity, but they present a vertical distribution of the mean values of Δσ⋆, indicating the absence of a trend. |
| In the text | |
|
Fig. C.1. Δσ⋆ against Δv⋆ with colour-coded values of the stellar population parameters (from top to bottom: fraction of young stars, mean age, colour excess, and metallicity) for the disc in NGC 1300. On the left side we represent the data with no smoothing and on the right side the LOESS-smoothed data. The grey rectangle represents the typical error in Δv⋆ (7 km s−1) and Δσ⋆ (9 km s−1). The uncertainties introduced by the smoothing are: ±0.11 for the YSF, ±1.4 Gyr for the mean age, ±0.05 for E(B − V), and ±0.07 dex for the metallicity. |
| In the text | |
|
Fig. C.2. Same as Fig. C.1, now for the ring in NGC 1300. The uncertainties introduced by the smoothing are: ±0.11 for the YSF, ±0.7 Gyr for the mean age, ±0.04 for E(B − V), and ±0.10 dex for the metallicity. |
| In the text | |
|
Fig. C.3. Same as Fig. C.1, now for the nucleus in NGC 1300. The uncertainties introduced by the smoothing are: ±0.08 for the YSF, ±0.6 Gyr for the mean age, ±0.03 for E(B − V), and ±0.08 dex for the metallicity. |
| In the text | |
|
Fig. C.4. Same as Fig. C.1, now for the disc in NGC 5248. The uncertainties introduced by the smoothing are: ±0.14 for the YSF, ±0.6 Gyr for the mean age, ±0.03 for E(B − V), and ±0.14 dex for the metallicity. |
| In the text | |
|
Fig. C.5. Same as Fig. C.1, now for the ring in NGC 5248. The uncertainties introduced by the smoothing are: ±0.14 for the YSF, ±0.7 Gyr for the mean age, ±0.05 for E(B − V), and ±0.3 dex for the metallicity. |
| In the text | |
|
Fig. C.6. Same as Fig. C.1, now for the nucleus in NGC 5248. The uncertainties introduced by the smoothing are: ±0.14 for the YSF, ±0.6 Gyr for the mean age, ±0.03 for E(B − V), and ±0.10 dex for the metallicity. |
| In the text | |
|
Fig. C.7. Same as Fig. C.1, now for the ring in NGC 1097 with a binning level at a target S/N of 250. The uncertainties introduced by the smoothing are: ±0.23 for the YSF, ±2.3 Gyr for the mean age, ±0.05 for E(B − V), and ±0.35 dex for the metallicity. |
| In the text | |
|
Fig. C.8. Same as Fig. C.1, now for the ring in NGC 1097 with a binning level at a target S/N of 350. The uncertainties introduced by the smoothing are: ±0.21 for the YSF, ±1.9 Gyr for the mean age, ±0.07 for E(B − V), and ±0.3 dex for the metallicity. |
| In the text | |
Current usage metrics show cumulative count of Article Views (full-text article views including HTML views, PDF and ePub downloads, according to the available data) and Abstracts Views on Vision4Press platform.
Data correspond to usage on the plateform after 2015. The current usage metrics is available 48-96 hours after online publication and is updated daily on week days.
Initial download of the metrics may take a while.