Fig. 3.
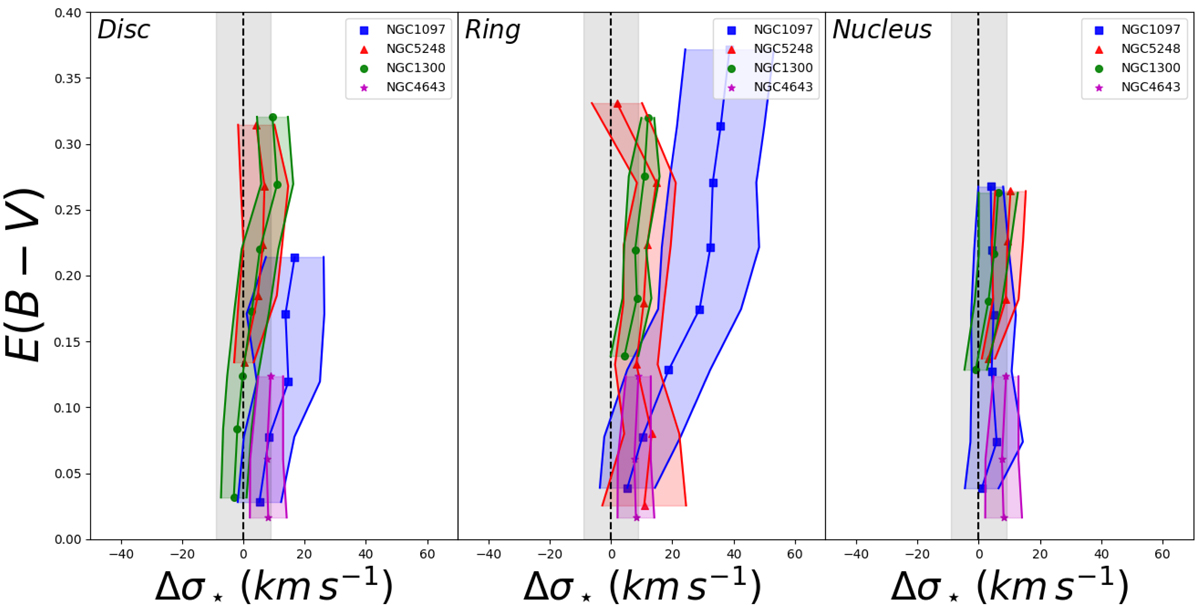
Observed values of Δσ⋆ against colour excess E(B − V) in the three selected regions for the four galaxies in the sample. We represent the mean values of Δσ⋆ estimated in equally spaced age bins. We also represent the 1σ uncertainty interval for these mean values as colour-shaded regions. The typical error in the Δσ⋆ estimate is represented as the grey-shaded area. In general we find vertical distributions of the mean values of Δσ⋆. The only exception is the ring of NGC 1097 where we find increasing values of Δσ⋆ when E(B − V) increases.
Current usage metrics show cumulative count of Article Views (full-text article views including HTML views, PDF and ePub downloads, according to the available data) and Abstracts Views on Vision4Press platform.
Data correspond to usage on the plateform after 2015. The current usage metrics is available 48-96 hours after online publication and is updated daily on week days.
Initial download of the metrics may take a while.