Fig. 4.
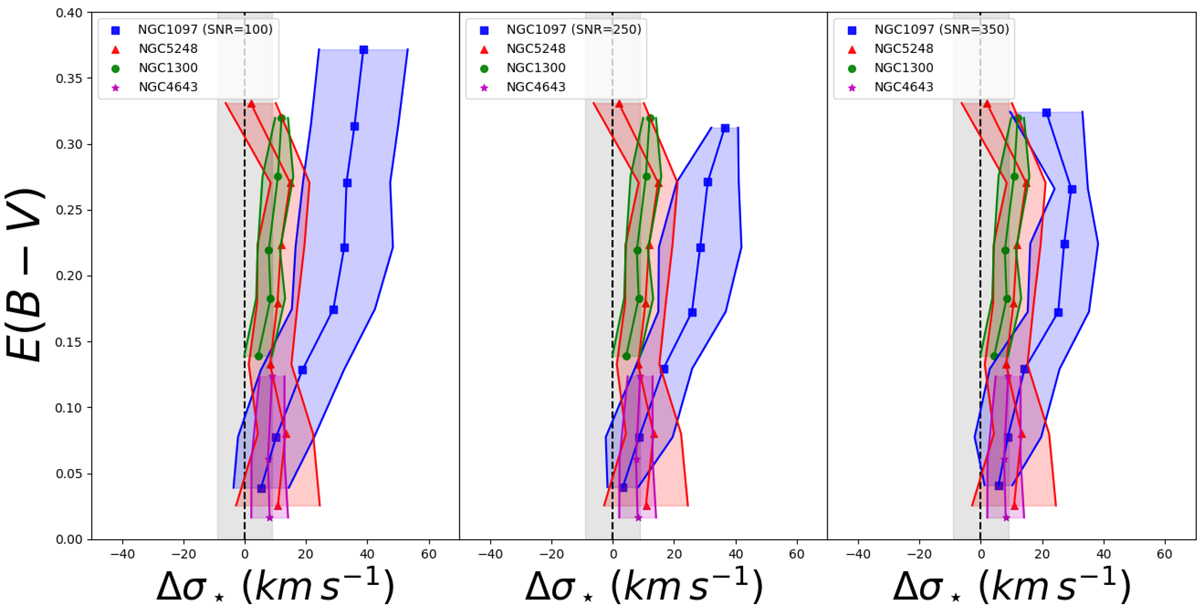
Changes in Δσ⋆ with the E(B − V) distribution in the ring in NGC 1097. We plot the results for three different target S/N for the GIST pipeline analysis (the blue series): 100 (left panel), 250 (central panel), and 350 (right panel). We can observe how the highest values of the colour excess disappear when we increase the S/N. At the same time the highest values of Δσ⋆ start to decrease. At S/N = 350 we cannot clearly discern the trend we observe for S/N = 100 and the distribution for the ring of NGC 1097 is similar to that for that of NGC 5248.
Current usage metrics show cumulative count of Article Views (full-text article views including HTML views, PDF and ePub downloads, according to the available data) and Abstracts Views on Vision4Press platform.
Data correspond to usage on the plateform after 2015. The current usage metrics is available 48-96 hours after online publication and is updated daily on week days.
Initial download of the metrics may take a while.