| Issue |
A&A
Volume 644, December 2020
|
|
|---|---|---|
| Article Number | A38 | |
| Number of page(s) | 23 | |
| Section | Extragalactic astronomy | |
| DOI | https://doi.org/10.1051/0004-6361/202039162 | |
| Published online | 27 November 2020 | |
Distribution of star formation in galactic bars as seen with Hα and stacked GALEX UV imaging⋆
1
Instituto de Astrofísica de Canarias, 38205 La Laguna, Tenerife, Spain
e-mail: simondiazgar@gmail.com
2
Departamento de Astrofísica, Universidad de La Laguna, 38205 La Laguna, Tenerife, Spain
3
Department for Physics, Engineering Physics and Astrophysics, Queen’s University, Kingston, ON K7L 3N6, Canada
4
Geneva Observatory, University of Geneva, Chemin des Maillettes 51, 1290 Sauverny, Switzerland
5
Space Physics and Astronomy Research Unit, University of Oulu, 90014 Oulu, Finland
Received:
11
August
2020
Accepted:
2
September
2020
Context. Stellar bars are known to gradually funnel gas to the central parts of disk galaxies. It remains a matter of debate why the distribution of ionized gas along bars and in the circumnuclear regions varies among galaxies.
Aims. Our goal is to investigate the spatial distribution of star formation (SF) within bars of nearby low-inclination disk galaxies (i < 65°) from the S4G survey. We aim to link the loci of SF to global properties of the hosts (morphological type, stellar mass, gas fraction, and bar-induced gravitational torques), providing constraints for the conditions that regulate SF in bars.
Methods. We use archival GALEX far- and near-UV imaging for 772 barred galaxies, and for a control sample of 423 non-barred galaxies. We also assemble a compilation of continuum-subtracted Hα images for 433 barred galaxies, 70 of which we produced from ancillary photometry and MUSE and CALIFA integral field unit data cubes. We employ two complementary approaches: (i) the analysis of bar (2D) and disk (1D) stacks built from co-added UV images (oriented and scaled with respect to the stellar bars and the extent of disks) of hundreds of galaxies that are binned based on their Hubble stage (T) and bar family; and (ii) the visual classification of the morphology of ionized regions (traced from Hα and UV data) in individual galaxies into three main SF classes: (A) only circumnuclear SF; (B) SF at the bar ends, but not along the bar; and (C) SF along the bar. Barred galaxies with active and passive inner rings are likewise classified.
Results. Massive, gas-poor, lenticular galaxies typically belong to SF class A; this is probably related to bar-induced quenching of SF in the disk. The distribution of SF class B peaks for early- and intermediate-type spirals; this most likely results from the interplay of gas flow, shocks, and enhanced shear in massive centrally concentrated galaxies with large bar amplitudes (the latter is supported by the lack of a dip in the radial distribution of SF in non-barred galaxies). Late-type gas-rich galaxies with high gravitational torques are mainly assigned to SF class C; we argue that this is a consequence of low shear among the faintest galaxies. In bar stacks of spiral galaxies the UV emission traces the stellar bars and dominates on their leading side, as witnessed in simulations. Among early-type spirals the central UV emission is ∼0.5 mag brighter in strongly barred galaxies, relative to their weakly barred counterparts; this is probably related to the efficiency of strong bars sweeping the disk gas and triggering central starbursts. On the contrary, in later types the UV emission is stronger at all radii in strongly barred galaxies than in weakly barred and non-barred ones. We also show that the distributions of SF in inner-ringed galaxies are broadly the same in barred and non-barred galaxies, including a UV and Hα deficit in the middle part of the bar; this hints at the effect of resonance rings trapping gas that is no longer funneled inwards.
Conclusions. Distinct distributions of SF within bars are reported in galaxies of different morphological types. Star-forming bars are most common among late-type gas-rich galaxies. Bars are important agents in the regulation of SF in disks.
Key words: galaxies: structure / galaxies: star formation / galaxies: evolution / galaxies: statistics
Data and full Table A.1 are only available at the CDS via anonymous ftp to cdsarc.u-strasbg.fr (130.79.128.5) or via http://cdsarc.u-strasbg.fr/viz-bin/cat/J/A+A/644/A38
© ESO 2020
1. Introduction
Stellar bars are common in the local Universe, with well over half of disk galaxies having a bar visible on optical and near-infrared images (e.g., de Vaucouleurs 1963; Sellwood & Wilkinson 1993; Knapen et al. 2000; Whyte et al. 2002; Laurikainen et al. 2004; Marinova & Jogee 2007; Menéndez-Delmestre et al. 2007; Aguerri et al. 2009; Méndez-Abreu et al. 2012; Buta et al. 2015; Díaz-García et al. 2016a, 2019a). Due to the non-axisymmetric mass distribution in bars, they stimulate angular momentum transfer and gas inflow in galaxy disks (Lynden-Bell 1979; Simkin et al. 1980; Shlosman et al. 1989; Athanassoula 1992a), and are thus an important agent in the secular evolution of galaxies (see the review by Kormendy 2013, and references therein).
The distribution of massive star formation (SF) in galaxy disks is conditioned by localized zones where gas clouds are both stable and dense enough to form stars, which Kennicutt (1989), following Toomre (1964), parameterized to depend on gas surface density and velocity dispersion. Velocity shear can limit SF, however, acting against the condensation of massive clouds (e.g., Reynaud & Downes 1998; Seigar 2005). Zurita et al. (2004) nicely illustrated how shear in a strong bar can locally inhibit the massive SF from a clear systematic offset they observed in their Fabry-Pérot Hα data between regions of high non-circular motions and active SF in the bar of NGC 1530. Although this effect is hard to observe, and has not been seen in many other galaxies, it does illustrate graphically the relation between bar dynamics and SF morphology. In general, the occurrence of massive SF zones is governed by the location of the spiral arms and dynamical resonances, with SF often concentrated in spiral arms and the rings that can form near the resonances.
In galactic bars, there is no uniform picture of where the SF occurs. Often there are regions of SF near the ends of the bar, and these can form parts of inner rings, as in NGC 5850 (Fig. 9, lower panel), or highlight the start of grand-design spiral arms, as in NGC 1300 (Fig. 9, upper panel). The sets of symmetric enhancements of stellar emission near the ends of the bar known as ansae are typically not star forming and have a stellar dynamical origin (Martinez-Valpuesta et al. 2007).
Bars stimulate gas inflow (Schwarz 1984; Combes & Gerin 1985), and where this inflow is slowed down in the vicinity of inner Lindblad resonances (e.g., Heller & Shlosman 1994; Knapen et al. 1995; Comerón et al. 2010) a nuclear ring can form and the gas accumulated within them can lead to important and visually striking star-forming nuclear rings, as in NGC 1097 (Fig. 10, upper panel). Bars have statistically been linked to enhanced gas concentration, and very clearly linked to enhanced SF in the central kpc region (e.g., Heckman 1980; Hummel 1981; Hawarden et al. 1986; Devereux 1987; Sakamoto et al. 1999; Jogee et al. 2005; Sheth et al. 2005; Regan et al. 2006; Lin et al. 2017; for a review of the early papers, see Knapen 2004), and often this manifests itself not as a ring but as a (circum)nuclear starburst, as in NGC 2712 or NGC 3185 (Figs. 2 and 3 in James & Percival 2016). The SF can be limited to the central region, as in NGC 0936 (Fig. 8).
Star formation can occur along the bar, but often does not. When it does, it can occur in a narrow linear or curved morphology either in the middle of the bar, as in NGC 7479 (see Fig. 1 in Zurita et al. 2001), or along one of its edges, as in NGC 1365 (Fig. 10, middle panel). Many bars are devoid of SF, as in the case of NGC 5850 (Fig. 9, lower panel), showing only a central SF peak. Finally, the bar sweeping up gaseous material often leads to a dearth of gas, and thus SF, in symmetric regions on either side of the bar (James et al. 2009); a good example is NGC 3351, shown in Fig. 4 of James & Percival (2016). This was referred to as the “SF desert” by James & Percival (2016, 2018) and the desert was confirmed from numerical modeling to consist of older stars by Donohoe-Keyes et al. (2019).
In this paper we use ultraviolet (UV) and Hα imaging to study the distribution of SF in bars in a statistical manner rather than by considering the detailed morphology of individual galaxies, for a sample of more than 800 barred galaxies from the Spitzer Survey of Stellar Structure in Galaxies (S4G; Sheth et al. 2010). As a result, we do not use all the possible categories described earlier in this Introduction, but concentrate on whether SF occurs at the inner or outer ends of a bar, and/or within it, as described in Sect. 3.
Our investigation builds on a small but very interesting body of past work. Verley et al. (2007a) characterized the Hα morphology of 45 suitable isolated galaxies from their AMIGA sample (see Verley et al. 2007b), classifying them into three main groups depending on whether or not emission is present from the central and bar regions of a galaxy (see also work by Martin & Friedli 1997; Neumann et al. 2019). Recently, Fraser-McKelvie et al. (2020) used 684 relatively face-on galaxies from the Mapping Nearby Galaxies at APO (MaNGA; Bundy et al. 2015) survey, which have a high probability of being barred following the classification by volunteer citizens in a Galaxy Zoo 2 project (Willett et al. 2013). They then classified their Hα images according to whether a galaxy shows SF in the center, inner ring, ends of the bar, or within the bar, concluding that only low-mass galaxies host SF along their bars, and that both the physical and SF properties of bars are mostly governed by the galaxy stellar mass.
We improve on several aspects of previous work, for example sample size (the samples of Verley et al. 2007a or Neumann et al. 2019 are small and did not probe the plentiful galaxies at the end of the Hubble sequence), the set of explored morphological and physical disk and bar parameters, and the quality of the multiwavelength imaging data. Fraser-McKelvie et al. (2020) use Hα images derived from MaNGA that have limited physical resolution across their sample, and depend on criteria for bar classification that are hard to quantify but can introduce important biases (e.g., towards the most prominent bars, judging from their too small overall bar fractions).
In addition, in Sect. 2 we introduce the stacking of UV bars (2D), based on the techniques developed by Díaz-García et al. (2016b) at 3.6 μm, and significantly improve on the averaging of SF radial profiles (in 1D) pioneered by James et al. (2009) (in Hα), using hundreds of images per sample bin. These techniques probe with unprecedented statistical significance the spatial distribution of SF in disks, whose dependence on global galaxy properties is discussed in Sect. 4, as well as the possible effect of stellar bars enhancing or inhibiting SF. Finally, in Sect. 5 we summarize the main results of this paper and their interpretation in light of galaxy evolution.
2. Stacking GALEX near- and far-UV images
Díaz-García et al. (2016b) obtained average 1D disk profiles and 2D bar density maps by stacking Spitzer Infrared Array Camera (IRAC) 3.6 μm images, which trace old stellar populations, in order to characterize the stellar mass distribution of more than a thousand disk galaxies and reveal signatures of bar-induced secular evolution.
Here, these averaging techniques are applied to Galaxy Evolution Explorer (GALEX) near-UV (NUV; λeff = 2267 Å) and far-UV (FUV; λeff = 1516 Å) images, so that SF activity in bars is analyzed with unprecedented statistical significance (emission at these UV wavelengths trace recent SF, up to ∼100 Myr; Kennicutt 1998). The UV stacks constitute a non-parametric characterization of the distribution of SF in bars, which may be useful for comparison with numerical models.
We use the sky-subtracted and masked images from the GALEX/S4G UV-IR Catalog by Bouquin et al. (2018; see also Bouquin et al. 2015), comprising 1931 galaxies of all morphological types that were gathered from the GALEX GR6/7 Data Release1, cross-matched with those of the S4G, and reduced following Gil de Paz et al. (2007). Roughly one-half of the data belong to the GALEX All-Sky Imaging Survey (AIS), whose images had exposure times of ∼100 s and allow the detection of point sources down to ≈20 AB mag (e.g., Bianchi et al. 2017). The rest of the galaxies were imaged in deeper GALEX surveys and had exposure times of 1000 s or more. The pixel size is 1.5 arcsec.
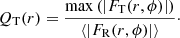
Mean FUV surface brightnesses (μFUV) are converted to SF rate surface densities (ΣSFR) following the prescription by Kennicutt & Evans (2012) and Madau & Dickinson (2014) (see Appendix B in Bouquin et al. 2018),
![$$ \begin{aligned} \mathrm{log_{10}} (\Sigma _{\rm SFR}) [M_{\odot }\,\mathrm{yr}^{-1}\,\mathrm{pc}^{-2}] =1.239-0.4\cdot \mu _{\rm FUV} [\mathrm{AB \, \mathrm{\,mag} \, \mathrm{\,arcsec}^{-2}}], \end{aligned} $$](/articles/aa/full_html/2020/12/aa39162-20/aa39162-20-eq1.gif)
assuming a Kroupa initial mass function (Kroupa 2001). These estimates are not corrected for extinction, and thus the values are lower boundaries of the true ΣSFR.
Our parent sample is made up of the 1345 disk galaxies with inclinations < 65° (according to Salo et al. 2015) in the S4G. Of these, 860 are barred according to Buta et al. (2015), of which 760 (∼88%) have available NUV and FUV imaging from Bouquin et al. (2018). We also use a control subsample of 423 non-barred and not highly inclined galaxies with available GALEX UV data.
2.1. Average UV bars (2D)
In order to study in detail the distribution of SF in bars, FUV and NUV images are scaled to a common frame determined by the sizes (rbar) and orientations of the bars, measured visually by Herrera-Endoqui et al. (2015) using 3.6 μm S4G images. Here we present a summary of the way the UV images are treated (for further details see Díaz-García et al. 2016b):
1. Deprojection to face-on view using the orientation parameters for the outer disk from Salo et al. (2015). To make sure that deprojections are reliable, we only use galaxies with “ok” quality flags for the orientations.
2. Fourier decomposition of the UV light distribution of the galaxy images (up to 40 azimuthal modes, using the NIR-QB code; Salo et al. 1999; Laurikainen & Salo 2002), and reconstruction of the image in a polar grid with 128 bins in the azimuthal direction (Salo et al. 1999).
3. Rotation of the image with respect to the bar major axis, imposing a bar position angle equal to zero.
4. Geometric reflection across the bar major axis to make the spiral arms wind clockwise (S-shaped) in case they wind counterclockwise (Z-shaped) in the 3.6 μm images. The correction of the orientation of the spiral arms (normally trailing, relative to the disk rotation) is important for our analysis: H II regions typically appear on the leading side of the bar (e.g., Sheth et al. 2002; Popping et al. 2010).
5. Scaling of the reoriented image to a grid of radius  , and width of the radial bin of 0.05 ⋅ rbar. This ensures a good sampling of the bar (the median bar radii in our sample are ∼10 and ∼20 resolution elements in GALEX and IRAC images, respectively) and also of the spiral arms slightly beyond the bar region.
6. Having uniformly scaled all the images of barred galaxies to a common physical framework, we are in the position to take subsamples and perform the bar stacks: the mean FUV and NUV surface brightness (weighted in mag arcsec−2) is obtained within each of the bins of the polar grid. Our stacking techniques yield roughly the same results (within uncertainties) regardless of the employed weighting when co-adding the light (flux or magnitudes) or the used measure of central tendency (mean or median) (for further details see Fig. 2 and explanations in Díaz-García et al. 2016b).
Bar stacks resulting from the co-adding of FUV and NUV images and the binning of our sample in the Hubble sequence are shown in Fig. 1. Azimuthally averaged luminosity radial profiles and the surface brightness along the bar major axis are directly extracted from the bar stacks, and are shown in Fig. 2. Uncertainties are estimated via the standard deviation of the mean ( ), which is typically ≲0.2 mag, as shown in Sect. 2.2.
The subsamples were binned by morphological types, separating S0s (−3 ≤ T < 0), early-type spirals (0 ≤ T < 3), intermediate-type spirals (3 ≤ T < 5), late-type spirals (5 ≤ T < 8), and Magellanic and irregular galaxies (8 ≤ T ≤ 10). The average ellipticity of stellar bars from Herrera-Endoqui et al. (2015), obtained via ellipse fitting (Jedrzejewski 1987) from 3.6 μm imaging, is highlighted with a black ellipse. A similar characterization of bar stacks as a function of the total stellar mass of the binned galaxies can be found in Appendix D (Figs. D.1 and D.2).
2.1.1. Spatial distribution of UV emission
Among spirals (0 ≤ T < 8), the UV emission leads with respect to the stellar bar (e.g., Sheth et al. 2002). This is not the case for the S0s (T ≤ 0), where the UV emission is circumnuclear and does not follow the bars. In addition, the leading and trailing sides of the bars cannot be identified when T > 8 because no spiral pattern is present, and thus the UV emission does not occupy a preferential side in bars hosted by irregular galaxies. Within the outer half of the bar ellipse (semi-major axis distances > 0.5 ⋅ rbar), the FUV flux on the leading side of the bar stacks (averaged over the two quadrants) is 21%, 16%, and 11% higher than on the trailing side for early-, intermediate-, and late-type spirals, respectively.
Clear differences stand out for early- and late-type spirals: when 0 ≤ T < 5 (Cols. 2 and 3 of Fig. 1), the UV emission dominates in the circumnuclear regions and at the bar ends, with a deficit of light in the middle part of the bar, whereas for T ≥ 5 the distribution of UV light is almost uniform across the bar. These trends are more clearly seen in Fig. 2: a hump at the bar end is noticeable in the surface brightness profiles of early- and intermediate-type spirals (especially in the cut along the bar major axis), whereas late-type galaxies present an exponential radial decay of the UV surface brightness. Late-type barred galaxies are brighter in UV wavelengths in general: this is not surprising, as these galaxies are known to be richer in gas and form stars more actively. We note that, in general, the trends are very similar in the NUV and FUV passbands.
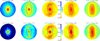 |
Fig. 1. Two-dimensional synthetic stellar bars constructed from co-added NUV (top) and FUV (bottom) images of disk galaxies that were oriented and scaled with respect to the bars, flipped to make the spiral arms wind clockwise (if needed), and grouped based on revised Hubble stage (T, increasing from left to right). The number of galaxies in each subsample is also indicated. Bar stacks are shown in units of mag arcsec−2 (see vertical bar for thresholds and color-coding) and cropped to a radius 1.5 ⋅ rbar, so that all binned galaxies are covered radially. The dotted lines show isophotal contours with a step of 0.35 mag arcsec−2. The ellipse represents the average ellipticity (3.6 μm) of the galaxies in the bin (from Herrera-Endoqui et al. 2015; Díaz-García et al. 2016a). The mean bar length is used as a unit, but the actual mean 3.6 μm bar lengths in kpc vary for each T-bin (see Fig. 11 and Table 3 in Díaz-García et al. 2016a) and are lowest among the faintest galaxies. |
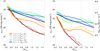 |
Fig. 2. Azimuthally averaged mean NUV (left) and FUV (right) luminosity profiles (solid lines), in bins of numerical Hubble type, obtained from the 2D bar stacks shown in Fig. 1. The dashed lines correspond to the surface brightness cut along the bar major axis. The vertical dotted line indicates the bar end. FUV luminosities are converted to ΣSFR (right y-axis of the right panel) using Eq. (1). |
2.1.2. Differences in UV emission between strongly and weakly barred galaxies
A relation between the strength of the bar and the presence of SF regions along the bar has been hypothesized (see, e.g., discussion in Jogee et al. 2002, and references therein), but whether such a connection exists remains unclear. To test this, we derived FUV bar stacks after splitting our sample into weakly barred (I/S B+I/SAB) and strongly barred (I/SA
 +I/SB) galaxies (Fig. 3), based on the classification of galaxy families by Buta et al. (2015)
2. Early-type (T < 5) and late-type (T ≥ 5≡ Sc) galaxies are studied separately; not only are they characterized by remarkably different structural properties (e.g., Díaz-García et al. 2016a,b), but also by distinct distributions of SF, as seen from the UV stacks (see Sect. 2.1.1).
+I/SB) galaxies (Fig. 3), based on the classification of galaxy families by Buta et al. (2015)
2. Early-type (T < 5) and late-type (T ≥ 5≡ Sc) galaxies are studied separately; not only are they characterized by remarkably different structural properties (e.g., Díaz-García et al. 2016a,b), but also by distinct distributions of SF, as seen from the UV stacks (see Sect. 2.1.1).
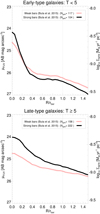 |
Fig. 3. Azimuthally averaged mean FUV luminosity profiles obtained from the bar stacks of weakly and strongly barred galaxies (based on the family classification from Buta et al. 2015) with total stellar masses 108.5 M⊙ < M* < 1011 M⊙, considering separately early-type (T < 5, upper panel) and late-type galaxies (T ≥ 5, lower panel). The same plots using NUV are shown in Fig. E.1. |
Among early-type spirals, the central FUV emission is ∼0.5 mag brighter for strongly barred galaxies, on average, than for their weakly barred counterparts. This translates into a difference in ΣSFR larger than 50%. On the other hand, weakly barred galaxies are characterized by a somewhat higher level of FUV emission in the middle and end parts of the bar. As discussed in Sect. 4, we interpret that such differences can be related to the subtle effect of strong bars sweeping the disk gas and inducing circumnuclear starbursts. A different picture is identified among late-type galaxies (T ≥ 5): strongly barred galaxies present more intense UV emission than weakly barred galaxies at all bar radii, and by more than 0.5 mag in the central parts in particular. The same trends are identified using NUV imaging (see Fig. E.1).
2.2. Average UV disks (1D)
To perform a direct comparison of the mean UV luminosity profiles of barred and non-barred galaxies, and also to study those hosting inner rings, we apply 1D averaging techniques (for a characterization of average profiles without separation into barred and non-barred galaxies, see also Fig. 4 in Bouquin et al. 2018). This also allows a direct estimate of the dispersion and uncertainties in our stacks.
Prior to the co-adding, the m = 0 Fourier intensity profiles are resized to a common frame determined by the extent of the disk in physical units (up to 25 kpc, using a 0.125 kpc wide radial bin), using spline interpolation (see Díaz-García et al. 2016b; Salo & Laurikainen 2017). The radial extent of the grid is controlled from the rough estimate of the galaxy outer radius that Salo et al. (2015) used to encompass the image region in the 2D photometric decompositions. In the construction of the average profile we must take into account that for some galaxies the extent of their profiles is limited by the image field of view. We therefore limit the averaging to those radii that are covered by at least 75% of the galaxies in the bin, unless stated otherwise. Uncertainties on the stacks are estimated from the standard deviation of the mean,  , where Ngals corresponds to the number of galaxies comprised in a certain bin.
We characterize the 1D radial profiles of UV surface brightness (μ) after binning the sample based on the total stellar masses (M*) of the host galaxies (from Muñoz-Mateos et al. 2015)3. In Fig. 4 we show the mean μNUV and μFUV obtained by scaling the density profiles to a common frame in physical units. The statistical dispersion of the luminosity profiles among the galaxies in each of the M*-bins is shown in Fig. 5. It is larger in the FUV (σ ≤ 1.3 mag) than in NUV (σ ≤ 1 mag), while the standard deviation of the mean 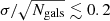 mag at all radii due to the rich sampling, and hence the differences in the mean μFUV and μNUV for the different M* and bar family bins probed in this work are statistically significant.
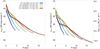 |
Fig. 4. Mean μNUV (left) and μFUV (right) 1D profiles as a function of galactocentric radius for different subsamples defined as a function of the total stellar mass (in bins of 0.5 dex; see legend) (see also Bouquin et al. 2018). Error bars correspond to the standard deviation of the mean ( |

 |
Fig. 5. As in Fig. 4, but for the dispersion of the μNUV (left) and μFUV (right) luminosity profiles. |
The UV luminosity follows an exponential slope as a function of radius (Fig. 4) (see also Fig. 3 in Bouquin et al. 2018), with a scale length that increases with increasing M*. The luminosity profiles in the outskirts are brighter in more massive galaxies. When M* > 1010 M⊙ a hump is detected in the inner regions, more clearly identified when M* > 1010.5 M⊙. This feature is associated with the presence of bars. This is confirmed in Fig. 6, where we study the mean μFUV for barred and non-barred galaxies separately (see also Fig. E.2 for μNUV). When M* > 1010 M⊙, barred galaxies have a deficit of FUV light within the bar region, which is not identified at the same radial distances in non-barred galaxies. Beyond that bar radius, the average FUV emission is again somewhat stronger in barred galaxies, hinting at a more active rate of SF in the spiral arms of barred galaxies, and possibly to the effect of bars redistributing gas across the disk. For the smaller M* bins, barred galaxies have stronger UV emission at all radii.
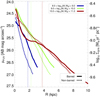 |
Fig. 6. Mean μFUV 1D radial profiles in bins of total stellar mass (1 dex in width), separating barred (solid line) and non-barred galaxies (dashed line) (95% radial coverage). The vertical dotted lines indicate the mean bar size of the barred galaxies in each of the M*-bins. The same plot for μNUV can be found in Fig. E.2. |
Finally, we test a possible causal connection between the detection of SF along the bar and the presence of inner rings (e.g., Neumann et al. 2019, and references therein), where gas can accumulate (Schwarz 1984) and no longer migrate inwards. We note that GALEX UV imaging has been used to study SF in rings in previous work in the literature (e.g., Comerón 2013; Kostiuk & Sil’chenko 2015). In Fig. 7 we show the mean FUV emission for the disk galaxies hosting inner rings and pseudorings (according to Buta et al. 2015). The μFUV profiles are scaled with respect to the deprojected ring semi-major axis (from Herrera-Endoqui et al. 2015). We find an FUV peak close to the ring radius, showing the intense SF taking place in rings. We note that the peak of mean SF is not located at the semi-major axis (SMA) distance, but at ∼0.8 SMA, because inner rings are not intrinsically circular (e.g., Comerón et al. 2014); in particular, the mean de-projected axis ratio of inner rings in the S4G (inclinations lower than 65°) is 0.76 ± 0.01 (σ = 0.12), in the range 0.4 − 1 (Díaz-García et al. 2019b).
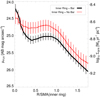 |
Fig. 7. Mean FUV 1D average luminosity profiles for barred (black) and non-barred (red) galaxies hosting an inner ring, with total stellar masses 109.5 < M*/M⊙ < 1011. Vertical bars correspond to the standard deviation of the mean. The luminosity profiles were scaled with respect to the deprojected semi-major axis of the inner ring, labeled SMA(inner ring), before they were co-added. |
We study separately barred and non-barred galaxies, resulting in very similar radial FUV distributions. Non-barred inner-ringed galaxies present slightly higher mean star formation rates (SFRs) along the disk than their barred counterparts. In Fig. E.2, we show similar profiles for the NUV, finding the same trends. We conclude that the spatial distribution of UV light in ringed galaxies is roughly the same for barred and non-barred galaxies; the implications are discussed in Sect 4.7.
3. Visual classification of the distribution of SF within bars in individual galaxies
In Sect. 2 we showed the statistical power of stacking techniques to characterize the SF activity in bars with a high signal-to-noise ratio and to detect low levels of SF. Nevertheless, by averaging hundreds of UV images we lose information on individual galaxies. In addition, the UV passbands are also not necessarily optimal for tracing the most recent SF bursts. Here, we compensate for these disadvantages by individually inspecting the distribution of FUV (same dataset as in Sect. 2, comprising 760 galaxies, with the inclusion of 12 additional images from the GALEX GR6/7 Data Release) and continuum-subtracted Hα emission (that traces SF in the last ∼20 Myr; Kennicutt 1998) in a large comprehensive sample with accurately determined disk and bar physical properties.
3.1. Compilation of Hα images for S4G barred galaxies and continuum subtraction
The sources of the Hα images used in this work are listed in Table A.1, and were mainly gathered from the NASA/IPAC Extragalactic Database (NED)4. We started with the compilation of 281 continuum-subtracted images that were used in Comerón (2013), mostly from the Hubble Space Telescope (HST) Archive5. We updated this compilation by adding 152 new images, making a final sample 433 S4G galaxies with available Hα continuum-subtracted imaging.
We produced additional Hα continuum-subtracted images for 17 galaxies following Knapen et al. (2004, 2006) (see also Böker et al. 1999), namely four from the SPLUS survey (Mendes de Oliveira et al. 2019), nine from JPLUS (Cenarro et al. 2019), three from the ESO archive, and one (IC 1158) from the original compilation by Comerón (2013). We scaled R-band continuum images to match the intensity level of the continuum emission in the Hα image. We measured the integrated intensity of at least six non-saturated foreground stars in the Hα and R-band continuum images, and obtained the scaling factor from the average ratio of the intensities obtained for each star. If not enough foreground stars were available, we employed a second method in which the intensity of each pixel in the Hα and R-band images were compared. If the color is constant across the image, the relation is expected to be roughly linear, with deviations associated with strong emission-line regions. In order to reduce the scatter and avoid possible saturated pixels, we re-binned some of the images and removed ∼1 − 10% of the brightest pixels of each image. Finally, the scaling factor was obtained from the slope of the linear regression fit. For further details the reader is referred to Knapen et al. (2004), who showed that the two methods described above (scaling based on stars and on pixel-to-pixel matching) give similar values of the Hα continuum-level.
For 31 galaxies we also used state-of-the-art data gathered with the Multi-Unit Spectroscopic Explorer (MUSE; Bacon et al. 2010) integral field unit at the Very Large Telescope (VLT). The mosaics have two sources. The first is the ESO Science portal6 where science-ready mosaics of several of our galaxies can be downloaded. We produced the others by downloading the raw MUSE data from the ESO archive (see Table A.1). We reduced each exposure using the MUSE pipeline (Weilbacher et al. 2012, 2014) under the Reflex environment (Freudling et al. 2013) using standard parameters. We manually aligned the exposures before combining them using the muse_exp_combine recipe to produce the final cube. For another 23 galaxies in our sample, fully reduced data cubes in the wavelength range 3750–7500 Å exist from the CALIFA survey (Sánchez et al. 2012, 2016; Walcher et al. 2014) and are publicly available via the CALIFA DR3 website7.
We produced the continuum-subtracted Hα maps from integral field unit (IFU) data by convolving with a filter of 20 Å FWHM centered at the Hα line (accounting for the Doppler shift using recession velocities taken from NED) and subtracting the adjacent continuum contribution within ±50Å, either manually (MUSE) or using PINGSoft8 software (Rosales-Ortega 2011) (CALIFA). We checked the quality of the subtraction by comparing the resulting maps with archival Hα continuum-subtracted images that existed for a few galaxies (e.g., the image of IC 0776 also appears in Gavazzi et al. 2003), in which case the CALIFA maps are not used (poorer resolution). Galaxies in which the bar was not fully covered by the IFU field of view were discarded.
In total, we produce continuum-subtracted Hα images for 70 galaxies that are also used for the statistical analysis presented in this paper. All of the 433 continuum-subtracted Hα images used here are publicly available at the CDS associated with this publication and at NED.
3.2. Classification method
We devise a classification method in which the distribution of SF at the bar region is assigned to a class (hereafter SF class) using criteria similar to those used in Verley et al. (2007a; see also Martin & Friedli 1997; Neumann et al. 2019; Fraser-McKelvie et al. 2020). Our classification system is given in Table 1.
Classification system of bar SF classes adopted in this work.
In Fig. 8 we display an illustrative example (NGC 0936) of class A (only circumnuclear SF), showing the 3.6 μm, GALEX FUV, and continuum-subtracted Hα images; in Fig. 9 we show those of NGC 1300 (top) and NGC 5850 (bottom), of class B (SF at bar ends, but not along the bar); and in Fig. 10 we show the images of NGC 1097 (top), NGC 1365 (middle), and NGC 3023 (bottom), which belong to class C (SF along the bar). In Table A.1, we list the SF class assigned to each galaxy in our sample. For classes B and C, subclasses are also considered depending on whether we detect circumnuclear SF (“a”) or not (“b”); these are also listed in Table A.1, but are not analyzed here. We also note that in a number of cases (94 in FUV and 35 in Hα) we either did not detect SF or could not reliably classify its distribution.
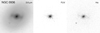 |
Fig. 8. Illustrative example of SF class A (only circumnuclear star formation): NGC 0936. Shown are the Spitzer 3.6 μm (S4G) (left), GALEX FUV (center), and continuum-subtracted Hα images (right; from Mendes de Oliveira et al. 2019, but subtraction performed by us). |
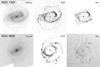 |
Fig. 9. As in Fig. 8, but for SF class B (star formation at the bar ends, but not along the bar) and subclass “a” (circumnuclear SF): NGC 1300 (top) and NGC 5850 (bottom). Hα images are from Knapen et al. (2004). |
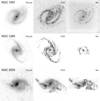 |
Fig. 10. As in Fig. 8, but for SF class C (galaxies with SF along the bar) and subclass “a” (circumnuclear SF): NGC 1097 (top), NGC 1365 (middle), and NGC 3023 (bottom). Hα images are respectively from Kennicutt et al. (2003) and from the ESO archive (see Table A.1) (mosaics and continuum-subtraction performed by us from the MUSE archive, covering a smaller field of view than the FUV and 3.6 μm images). |
The assignment of a SF class to each galaxy in our sample was performed by F.D.M., who examined the whole sample twice (nine months time-spacing, allowing him to re-visit contradicting cases), consistently obtaining the same statistical trends (see next sections). The classifications of the FUV and Hα samples were done independently, so that the visual analysis was unbiased. Images were navigated using SAOImage DS9 and the constrast was varied to make the H II knots, clumps, and filaments stand out.
In Table 2 we indicate the number of galaxies classified in each category A, B, and C, as well as the number of non-detections (N) and uncertain cases (class U). Of 772 barred galaxies with available FUV imaging, the percentages (and binomial errors) of SF classes A, B, and C are 13 ± 1.2%, 25.4 ± 1.6%, and 49.5 ± 1.8%, respectively, while 1.4 ± 0.4% present no emission (N) and 10.8 ± 1.1% are uncertain (U). For the 433 with available Hα images, the percentages are consistently 12.5 ± 1.6%, 30 ± 2.2%, and 49.7 ± 2.4% for SF classes A, B, and C, while 4.4 ± 1% and 3.7 ± 1% belong to classes N and U, respectively. We note that statistical trends of SF classes presented in the next sections are roughly the same regardless of the passband used; however, in some cases the classification in Hα is not the same as in FUV (23 cases in class A, 29 in class B, 3 in class C) mainly as a consequence of differences in the traced SF timescales in the two passbands, image depth, resolution, size and irregularity of bars, or unavoidable subjectivity.
In addition, we reassess the number of inner rings that are active, expanding the work by Comerón (2013) by enlarging his collection of Hα images for the barred galaxies in the S4G. We focus on the inner-ringed galaxies identified by Buta et al. (2015) in IRAC 3.6 μm S4G images. An example of a galaxy with an active inner ring (NGC 5850) is shown in Fig. 9. In Table A.1, we indicate whether inner rings are active (rA) or passive (rP). Using FUV images the number of barred galaxies classified as rA is 253 (90.4 ± 1.8%); only 23 (8.2 ± 1.6%) belong to class rP, while 4 (1.4 ± 0.7%) are uncertain (rU). When using Hα these numbers are 175 (80.6 ± 2.7%), 35 (16.1 ± 2.5%), and 7 (3.2 ± 1.2%), respectively. Further analysis is presented and discussed in Sect. 4.7.
3.3. Frequency of SF categories as a function of morphological type
Our goal is to determine whether different distributions of SF in bars depend on the global properties of the host galaxy, focusing on the galaxies with SF classes A, B, and C, and excluding from the analysis uncertain cases (U). In Fig. 11 we show the fraction of SF classes as a function of the morphological type of the host galaxies from Buta et al. (2015), including binomial counting errors (error bars), using classifications based on FUV and continuum-subtracted Hα images.
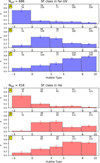 |
Fig. 11. Fraction of SF classes as a function of the revised Hubble stage, classified based on the FUV (upper panels, in blue) and continuum-subtracted Hα emission (lower panels, in red). The subpanels correspond to SF classes A (only circumnuclear SF, top), B (SF at the bar ends, but not along bar, middle), and C (SF along bar, bottom). Error bars correspond to binomial errors. Indicated for each category is the number of analyzed galaxies within the bin (bottom row of numbers), and the number of identified cases in each SF class (top row of numbers). In the upper left corners the total number of analyzed galaxies (Ngal) are given. |
The histograms of the frequency of the three SF classes are significantly different. For SF class A, the distribution peaks for S0s (∼60 − 70%) and drops among the spirals (≤20%). SF class B is dominant in early- and intermediate-type spirals (∼40 − 60%), and is a factor of ∼2 higher than in their late-type counterparts. A negligible amount of lenticulars belong to SF class B. Lastly, for SF class C, the fraction increases with increasing Hubble type: a maximum frequency of ∼60 − 75% is found for Sc and irregular galaxies (5 ≤ T ≤ 10), while a marginal ∼10 − 20% is found for S0s. In conclusion, the modes of the statistical distributions of SF classes A, B, and C are clearly segregated in the Hubble sequence, even though examples of all SF classes can be found for a given T-bin. These reported trends are qualitatively the same regardless of the passband used, either FUV or Hα.
3.4. Frequency of SF categories as a function of total stellar mass
While much can be learned from the study of galaxy properties in the Hubble sequence, it is also convenient to use quantifiable physical parameters such as the total stellar mass. In Fig. 12 we show the frequency of SF classes as a function of M*, where clear trends stand out: e.g., the fainter the galaxy, the more frequent the SF class C is. That is, low-mass galaxies tend to host bars that are actively forming stars along the whole extent of the bar.
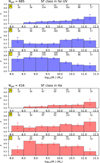 |
Fig. 12. As in Fig. 11, but as a function of total stellar mass of the host galaxy, in bins of 0.5 dex and in units of solar masses. |
Specifically, ≳60% of the galaxies with M* < 1010 M⊙ belong to SF class C, and the fraction declines with increasing M*, very clearly in the FUV sample. Even so, ∼50% of the galaxies with 1010 M⊙ < M* < 1011 M⊙ are classified as C in the Hα sample. The fraction of SF class A peaks for the highest M*-bin. In general, the frequency of class B is higher among massive systems (39.5 ± 2.9% and 36.4 ± 3.3% at FUV and Hα, respectively, when M* > 1010 M⊙) than among their faint counterparts (fractions of 20 ± 2% and 25.6 ± 3.1%), but the histogram is not peaked.
3.5. Frequency of SF categories as a function of gas fraction
The global content of atomic hydrogen in the galactic disk indicates the principal fuel reservoir for SF, even though the main fuel for SF is molecular gas. In Fig. 13 we show the frequency of SF classes against the relative content of atomic gas (i.e., the mass of H I gas normalized by the total stellar mass). Atomic gas masses are estimated as (e.g., Giovanelli & Haynes 1988; Erwin 2018; Díaz-García et al. 2019b)
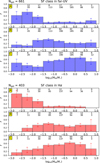 |
Fig. 13. As in Fig. 11, but as a function of the H I gas fraction (relative to the total stellar mass), in bins of 0.5 dex. |

where m21c is the corrected 21 cm line flux in magnitude from HyperLEDA and D is the distance to the galaxy (in megaparsecs) adopted by Muñoz-Mateos et al. (2015). We confirmed the good agreement between our heterogenous MHI estimates and those available from The Arecibo Legacy Fast ALFA Survey (ALFALFA; Haynes et al. 2011) for the overlap between the two samples (less than 25% of our galaxies).
The distribution of the three main SF categories are somewhat different when studied versus MHI/M*, resembling the behavior in the Hubble sequence (Sect. 3.3). The frequency of SF class A (C) decreases (increases) with increasing gas fraction. The mode of SF class B (∼40%) occurs for intermediate gas fractions with −1.5 ≤ log10(MHI/M*)≤ − 1.0, and its distribution is rather flat (∼20 − 30%) among the gas-rich galaxies.
The fraction of SF categories versus Qb is shown in Fig. 14, confirming differences in the distribution of SF classes identified earlier. The occurrence of SF class B peaks at ∼40% for 0.2≤ Qb ≤ 0.3, and smoothly decreases towards both weaker and stronger bars. This is an intermediate case between SF classes A and C, which hints at a physical transition of SF and local dynamical conditions in bars. SF class C is more typical of barred galaxies with high gravitational torques (strong bars); there is a sharp increase in its frequency with increasing Qb.
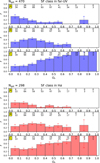 |
Fig. 14. As in Fig. 11, but as a function of the bar strength, measured from the maximum of the tangential-to-radial force ratio at the bar region, using bins of 0.1. |
3.6. Frequency of SF categories as a function of gravitational torque
We finally study the frequency of SF categories as a function of the gravitational torque measured by the tangential-to-radial force ratio (FT/⟨FR⟩) (e.g., Buta & Block 2001; Laurikainen et al. 2002, 2004; Laurikainen & Salo 2002). This test is especially relevant in that it sheds light on the physics driving SF across bars (see Sect. 4.4): tangential forces trace bar-induced gas motions, while radial forces control circular velocities in the inner parts, and thus the degree of shear (e.g., Seigar et al. 2005). In particular, we use the radial force profiles derived by Díaz-García et al. (2016a) from 3.6 μm S4G imaging, following Combes & Sanders (1981):
Here r and ϕ refer to the radial distance and azimuthal angle, respectively. Specifically, the maximum of QT at the bar region is used as proxy of the bar-induced perturbation strength (e.g., Buta & Block 2001; Díaz-García et al. 2019a), called Qb. We note that at the bar region the unaccounted dark halo contribution to radial forces is likely to be only minor, and becomes somewhat important for later types, implying a reduction of ∼20 − 25% on Qb for T = 7 − 10 (Díaz-García et al. 2016a).
4. Discussion
We report differences in the statistical distributions of star-forming and passive bars in the S4G survey, pointing to the influence of global morphological and physical properties on the distribution of SF activity in the central regions of galaxies. The S4G is representative of the local Universe despite not being complete in any quantitative form (e.g., volume) in its current version. It is currently under completion with analysis of new Spitzer 3.6 μm for early-type galaxies with T ≤ 0 (Sheth et al. 2013), and new ground-based i-band imaging for relatively gas-poor late-type galaxies.
We use archival GALEX FUV and NUV imaging of 772 barred galaxies and a compilation of 433 continuum-subtracted Hα images combining CALIFA and MUSE IFU data cubes with archival imaging of better resolution and employ both stacking techniques and visual classifications. Here, we discuss the statistical trends reported in Sect. 2 (stacking techniques) and Sect. 3 (visual inspection of images), which consistently yield similar results in all used passbands (Hα, NUV, and FUV), and their importance in shedding light on the regulation of the SF activity by bars.
4.1. Evidence for bar-induced secular evolution in the central regions of disk galaxies
The torques exerted by stellar bars are expected to provoke the flow of gaseous and stellar material within the disk, driving the secular evolution of the inner parts of the galaxy, as established in simulation models since the 1990s (e.g., Athanassoula 1992b; Wada & Habe 1992; Friedli & Benz 1993; Sellwood & Wilkinson 1993; Knapen et al. 1995; Pérez et al. 2004; Fragkoudi et al. 2016). Dark matter bars (Petersen et al. 2016; Collier et al. 2019), if present, might also contribute to this effect. Evidence of gas streams in barred spirals was reported in the 1960s (e.g., de Vaucouleurs & de Vaucouleurs 1963, studying NGC 4027 and NGC 7741). The funneled gas might eventually be spent in central starbursts, and contribute to the buildup and evolution of disk-like bulges (Kormendy & Kennicutt 2004).
Observational evidence of secular evolution within the bar region comes from detections of inner rotating stellar and gaseous substructures in the center of barred galaxies (e.g., Comerón et al. 2008; Pérez et al. 2009; Kormendy 2013; Méndez-Abreu et al. 2014; Seidel et al. 2015, and references therein), including nuclear rings (e.g., Knapen et al. 1995; Knapen 2005; Comerón et al. 2010; Leaman et al. 2019) and inner bars (e.g., Erwin & Sparke 2002; de Lorenzo-Cáceres et al. 2019; Méndez-Abreu et al. 2019); from enhanced central SF and chemical abundances (e.g., Ellison et al. 2011; Oh et al. 2012; Florido et al. 2015; Vera et al. 2016; Catalán-Torrecilla et al. 2017; Lin et al. 2020); and in general from stellar populations analyses (e.g., Pérez et al. 2007, 2009, 2017; Coelho & Gadotti 2011; Sánchez-Blázquez et al. 2011, 2014; Pérez & Sánchez-Blázquez 2011; de Lorenzo-Cáceres et al. 2012, 2013; Gadotti et al. 2015, 2019; Seidel et al. 2016; Fraser-McKelvie et al. 2019; Neumann et al. 2020).
On the other hand, the gas swept by bars can eventually fuel active galactic nuclei (AGN). However, in spite of the proposed mechanisms based on numerical simulations (e.g., Shlosman et al. 1989; Emsellem et al. 2015), it remains unclear how galaxies drive this gas to the central ∼100 pc to feed the supermassive black holes (e.g., Knapen et al. 2000; Wada 2004; Hao et al. 2009; Lee et al. 2012; Cisternas et al. 2013, and references therein).
4.2. Insights from UV stacking: strong bars redistribute gas and nourish central star formation
Based on the analysis of mean stellar density profiles derived from 3.6 μm images with a large unbiased sample, Díaz-García et al. (2016b) and Salo & Laurikainen (2017) provide evidence for bar-induced secular evolution of disk galaxies in terms of enhanced central mass concentration. In Sect. 2.1 we describe how we applied these same averaging techniques to obtain mean bars and disks at UV wavelengths, tracing SF up to 108 yr. We used GALEX images of S4G galaxies from Bouquin et al. (2018) and the parameterization of bars (length, position angle, shape, and strength) at 3.6 μm from Herrera-Endoqui et al. (2015) and Díaz-García et al. (2016a).
Inferences on the distribution of SF based on UV (and to a lesser extent Hα) emission are affected by extinction, and thus any estimated SFR is a lower boundary to the true value. The dust tends to re-radiate the absorbed UV in mid-IR wavelengths. This is beyond the scope of this paper, but will be assessed in future work (Díaz-García et al., in prep.) for a subsample of S4G galaxies. Highly inclined galaxies (where dust absorption is greatest) are not included in our analysis. We have not deconvolved the averaged luminosity profiles with the GALEX point spread function (∼6 arcsec), whose wings should produce the largest uncertainties in the outermost regions of the galaxies, which are not probed here.
Stacking techniques allow us to average hundreds of UV images per sample bin and detect low levels of SF (Sect. 2). This is an important step forward in the study of SF in bars, as we use a significantly larger sample compared to previous works (see Sect. 1), resulting in a more in-depth analysis. Sample bins were defined based on detailed visual estimates of bar strength from Buta et al. (2015), thus testing with high statistical significance the role of bars in triggering or preventing SF.
We showed that, among early-type disk galaxies, the average central UV emission is ∼0.5 mag brighter (i.e., ≳50% larger ΣSFR) when only strongly barred galaxies are considered, relative to their weakly barred counterparts (the latter, in turn, present slightly higher levels of UV emission in the middle and end parts of the bar) (Figs. 3 and E.1). This is most likely related to the efficiency of strong bars sweeping the disk gas and nourishing central starbursts. The latter is predicted in numerical models whose output resemble early-type disk galaxies (see Sellwood & Wilkinson 1993, and references therein).
On the other hand, the UV central surface brightness of barred galaxies is not significantly brighter than that of non-barred galaxies (Figs. 6 and E.2), which may cast doubt on the role of bars in central SF enhancement. Among the massive galaxies (M* ∈ [1010 − 1011]⋅M⊙) the central UV emission in barred galaxies is however higher relative to the underlying exponential disk. Following this line, Díaz-García et al. (2016b) showed that the central deviation from an exponential slope of the mean stellar density profile is also larger in barred galaxies (see their Fig. 8). Moreover, since UV traces timescales that are about the same as dynamical ones (and even longer in the central parts of galaxies) the bar potential might have changed substantially after enhancing the central UV emission. In other words, some bars might have weakened or even dissolved after feeding gas to the circumnuclear regions (e.g., Shen & Sellwood 2004), while SF still takes place at z ≈ 0 out of gas reservoirs that can last for hundreds of Myr. However, bar dissolution is implausible according to most modern simulations (e.g., Athanassoula 2013, and references therein).
Barred galaxies present higher UV emission relative to their non-barred counterparts when M* < 1010 M⊙. As for the largest M*-bins, barred galaxies have somewhat brighter UV profiles beyond the radii where bars typically occur (Sect. 2.2). Likewise, Díaz-García et al. (2016b) showed that, on average, barred galaxies have disks with longer scale lengths and fainter extrapolated central surface brightnesses than non-barred galaxies (see also Sánchez-Janssen & Gadotti 2013; Erwin 2019). This is probably related to bars causing a mixing of gas and stars and the spread of the disk (e.g., Athanassoula & Misiriotis 2002; Minchev et al. 2011; Athanassoula 2012; Seidel et al. 2015)9, perhaps as a result of the coupling between bar and spiral amplitudes (Salo et al. 2010; Minchev et al. 2012; Díaz-García et al. 2019a; Hilmi et al. 2020). In other words, spiral arms are loci of active SF, and their amplitudes are larger in barred galaxies than in non-barred ones (see Fig. 9 in Díaz-García et al. 2016b). This translates into a higher UV emission beyond the bar radius. We conclude that bars are important agents in the regulation of the SF in disk galaxies.
4.3. Is SF quenching in galaxies bar-driven?
Bar-driven central starbursts have been proposed as the mechanism that eventually depletes the gas in barred galaxies, unless it is replenished from the outside. However, whether the presence of a bar is connected to the total SFR in a galaxy remains a matter of debate (e.g., Hawarden et al. 1986; Dressel 1988; Puxley et al. 1988; Aguerri 1999; Sheth et al. 2002; Verley et al. 2007a; Wang et al. 2020). For instance, using Hα imaging of galaxies in the Coma (Gavazzi et al. 2015a) and Local superclusters (Gavazzi et al. 2012), Gavazzi et al. (2015b) proposed that strong bars play an important role in the quenching of the SF of massive galaxies since z = 3. This is supported by their observations at different z of a declining bar fraction for non-quenched galaxies, and is also consistent with the study by Cheung et al. (2013), who found a larger bar fraction among galaxies with a low total specific SFR (i.e., SFR divided by M*). Similar trends have been found in the local Universe: a drop in the bar fraction among gas-rich galaxies was reported by Masters et al. (2012) (see also Wang et al. 2012; Kruk et al. 2018) based on the Sloan Digital Sky Survey (SDSS; Gunn et al. 2006). Further supporting this picture, Fraser-McKelvie et al. (2020) find a segregation in the SFR-M* relation as a function of scaled bar length, where SF classes (very similar to those used in this paper) also separate clearly. If true, the interpretation of these statistical trends is affected by a chicken or egg causality dilemma: are strong bars responsible for galaxy quenching (e.g., Khoperskov et al. 2018) or do they preferentially form in red gas-poor galaxies (see, e.g., Athanassoula et al. 2013; Villa-Vargas et al. 2010)?
The causality between bars and quenching might also be linked to the observation that in lenticulars (T ≤ 0), and in gas-poor massive galaxies in general, the UV emission is scant across the disk and only circumnuclear (Sect. 2.1) and does not follow the bar (see also Sects. 3.3–3.5). However, UV might not be the most reliable tracer of SF or young populations among the reddest galaxies, as discussed in Bouquin et al. (2018), i.e., the emission can also be coming from evolved stars (UV-upturn), for instance main-sequence turnoff or extreme horizontal branch stars (e.g., Yi et al. 2005, 2011). However, elliptical galaxies are not included in our analysis, and the discussed effect is not expected to be so severe among S0s. In addition, the statistical trends when only using Hα are basically the same. In Appendix B we check and confirm that the statistical trends for the frequency of SF classes are not determined by the presence of AGN (as reported by Véron-Cetty & Véron 2010), which is a source of photoionization. Likewise, Fraser-McKelvie et al. (2020) used Baldwin, Phillips and Terlevich (BPT; Baldwin et al. 1981) diagrams reproduced from IFU data across the bar spaxels from MaNGA to conclude that the bulk of the Hα emission in barred galaxies is associated with SF and not with AGN emission.
The connection between bars and quenching reviewed above is challenged by the fact that bars among late-type galaxies in the S4G (typically gas rich) are unexpectedly frequent (Buta et al. 2015) and long (Díaz-García et al. 2016a) relative to the sizes of their host disks (see also Erwin 2019), yet their age and exchange of angular momentum might be much different from earlier types. Díaz-García et al. (2016a) speculated that many of the late-type bars identified in the S4G would possibly be overlooked if they were observed at higher redshift, given their faint disks (see their Sect. 5.1). On the other hand, as discussed by Buta et al. (2015), the types of bars seen in nearby late-type galaxies may not necessarily be the ones we see at high redshift.
Erwin (2018) showed that SDSS-based studies tend to underestimate the bar fraction (mainly among low-mass, blue, gas-rich galaxies) due to poor spatial resolution and the correlation between bar size and stellar mass. He also found that the bar fraction is roughly constant with g − r color and atomic gas fraction. In addition, Díaz-García et al. (2019b) do not find differences on SFRs, gas fraction, or [FUV]-[3.6] color between barred and non-barred S4G galaxies based on the use of clustering algorithms (self-organizing maps). On the other hand, it is known that S4G missed galaxies due to sample selection based on H I recessional velocities. However, this alone is not sufficient to explain the discrepancies between the SDSS and S4G surveys, such as the overall lower bar fraction in the former or its sharp decrease towards low-mass gas-poor galaxies.
We argue that a definite connection between bar fraction and SF quenching is still lacking in the literature. A new picture may arise from forthcoming surveys in the next decade with the next generation of telescopes (e.g., LSST, JWST, WFIRST, EUCLID). This will allow us to study the cosmic bar fraction (e.g., Sheth et al. 2008; Nair & Abraham 2010) with unprecedented depth and resolution, and with the aid of automated bar detections that are based on neural networks (e.g., Domínguez Sánchez et al. 2018).
4.4. Spatial distribution of SF in galactic bars
The distribution of ionized gas in the bar region, traced from the Hα emission, can be distributed along the bar; concentrated in the nuclear or circumnuclear regions, with little or no emission from the bar; and in both the bar and the nuclear region (Martin & Friedli 1997; Sheth et al. 2002; Verley et al. 2007a; Zurita & Pérez 2008). Interest has emerged on this topic with the advent of large surveys (e.g., James et al. 2004) and the use of homogenous IFU data (e.g., Neumann et al. 2019; Krishnarao et al. 2020).
Most of the work attempting to classify the SF in bars has been carried out with small samples. In order to provide the most complete study with a large unbiased sample of objects that are not highly inclined, in Sect. 3.2 we presented a simple visual classification system (outlined in Table 1) for the galaxies in the S4G survey. Fraser-McKelvie et al. (2020) recently presented a study of the SFR and distribution in 684 barred galaxies surveyed in MaNGA with an approach similar to ours. While they study the frequency of SF categories as a function of the total stellar mass and global SFR, here we test how SF relates to M* and to other parameters such as T-type, gas fraction, and tangential-to-radial forcing. Their use of IFU data has advantages (e.g., analysis with a homogeneous dataset of BPT diagrams) and disadvantages (e.g., poorer angular resolution) compared to our data, and represents an important complement to our paper.
To date, there is no clear understanding about the influence of local dynamical conditions on the SF activity in bars. The formation of new stars out of molecular clouds along the bars is expected to be regulated by the effect of shear, which can be controlled by orbits making up the bar (e.g., Athanassoula 1992a). Jogee et al. (2002) discussed that SF can be induced in weak bars, owing to the weaker shocks and shear, and mention the case of galaxies like M 100 (Elmegreen et al. 1989), NGC 4254, and NGC 4303 (Koopmann 1997). Numerical simulations by Vanhala & Cameron (1998) show that weak shocks with speeds of order 20–30 km s−1 can indeed favor the collapse of gas and the formation of stars. In some cases, the distribution of molecular gas indicates that the SF along the bar appears to be inhibited in some locations of the dust lanes due to the high strength of shocks and shear stress (e.g., Reynaud & Downes 1998). This is confirmed in the fluid dynamics simulations by Athanassoula (1992a). Nevertheless, H II regions have been found under these conditions in other galaxies (e.g., Martin & Friedli 1997; Sheth et al. 2002; Zurita & Pérez 2008). Furthermore, observations of Hα velocity gradients showed that shear makes SF drop, whereas shocks enhance it in general (Zurita et al. 2004).
In Sect. 2.1 we showed that in bar stacks of spiral galaxies (0 < T < 8) the UV emission traces the stellar bars and dominates on their leading side, a behavior expected from simulations that model bar-triggered gas inflow (e.g., Athanassoula 1992a). H II regions on the leading side of the bars have been detected (e.g., Sheth et al. 2002; Popping et al. 2010; Fraser-McKelvie et al. 2020), and are expected to be due to the combined effect of shear and turbulence forces inhibiting SF in most places, but not on the leading side of the bar (Emsellem et al. 2015; Renaud et al. 2015) (for pioneering theoretical input on the interplay between shear, shocks, and SF, see Athanassoula 1992b).
4.5. Differences in the distributions of SF classes A–B–C
We find distinct distributions in the Hubble sequence of the loci of SF within bars, using both stacking techniques (Sect. 2.1.1) and visual classifications (Sect. 3.3). Differences in the statistical distributions of the star-forming and passive bars are also reported as a function of physical properties, such as MHI/M* (Sect. 3.5) and FT/⟨FR⟩ (Sect. 3.6). However, the segregation of SF classes (especially between B and C) is less clear as a function of M* (Sect. 3.4), which is not surprising as the Hubble sequence is not a mass sequence (e.g., Fig. 1 in Laine et al. 2016). We also note that SF classes are not clustered (e.g., examples of any SF class can be found for any given T-bin).
We find that bar stacks comprising late-type galaxies (T ≥ 5) have SF that is more evenly distributed along the bar major-axis, and that the UV emission is higher for strong bars at all bar radii (Sect. 2.1). Likewise, by studying individual objects we show that the fraction of star-forming bars (category C) is larger for later types (Sect. 3.3). In Appendix B we checked that the depth of FUV imaging does not affect the statistical trends presented in this work: limiting the analysis to the deepest GALEX images yields the same results in the Hubble sequence.
The correlation between Hubble type (in a narrower T range) and the presence of SF along the bar has previously been reported from smaller samples that did not probe the plentiful galaxies at the end of the Hubble sequence (e.g., Phillips 1996). García-Barreto et al. (1996) showed that SBb galaxies tend to host less SF along bars than SBc. Among the spirals, the dissimilarity in the distributions of SF classes B and C in the Hubble sequence is likely related to general differences in the mass distribution and photometric/kinematic properties of disks in galaxies with T-type higher or lower than ∼5 (Díaz-García et al. 2016b). The former have larger central mass concentrations than the latter, among which many galaxies are bulge-less (Salo et al. 2015; Díaz-García et al. 2016b), and the shape of their rotation curves and mass distribution is remarkably different.
Late-type gas-rich galaxies are characterized by low amplitude, slowly rising rotation curves (e.g., Persic & Salucci 1991). Thus, the shear (Γ) in these galaxies might be lower at the bar region (favoring SF; Seigar 2005) compared to their early-type counterparts, which can be estimated from the slope of the rotation curves (V) in the central regions: Γ = −dlnΩ/dlnr, where Ω(r) = V/r is the angular velocity (e.g., Seigar et al. 2006; Fujii et al. 2018) at a given radius r, and Γ = 1 in the flat regime. This interpretation is also favored by our observations that star-forming bars are typically hosted by disk galaxies with high tangential-to-radial force ratios (Sect. 3.6). FT traces the bar-induced gravitational torques and the efficiency of the bar potential controlling the orbits of the gas (Seidel et al. 2015). ⟨FR⟩ determines the stellar contribution to the circular velocity (e.g., Díaz-García et al. 2016a, 2019b), which in turn gives a lower bound for the rotation curve of the galaxy in the inner parts (the nuclear regions tend to be baryon dominated according to, e.g., Erroz-Ferrer et al. 2016). For a given galactocentric radius and galaxy size, the higher the ⟨FR⟩ values the larger the shear, and thus the torque parameter (Qb) is related to the SF activity.
In conclusion, a lower shear is likely in Sc-irregular and in low-mass galaxies in general, where the inner slope and amplitude of the rotation curve are lowest (e.g., Díaz-García et al. 2016a; Díaz-García & Knapen 2020) and Qb is largest (e.g., Díaz-García et al. 2016a). The latter is mainly due to the dilution of bar gravitational torques by the bulge contribution to the overall radial force field (Block et al. 2001; Laurikainen & Salo 2002), which dominates over the dark matter halo dilution (Díaz-García et al. 2016a). This is in spite of the fact that bar-induced tangential forces are probably stronger among the largest galaxies with the most massive bars (massive disks host bars with large m = 2 Fourier density amplitudes; Díaz-García et al. 2016a). On the other hand, for a given M*, a higher FT/⟨FR⟩ can cause a twist on stellar orbits, enhancing the local shear. In addition, in Sect. 2.2 we showed that, on average, non-barred galaxies are characterized by exponentially decaying UV luminosity profiles without any light deficit in the central regions (unlike in barred ones), in agreement with reports by James et al. (2009) that were based on (1D) Hα averaging. Altogether, this implies that the dynamical conditions determined by the axisymmetric stellar components alone cannot explain the inhibition of SF, and hence bars play a major role.
We confirm the drop in the frequency of star-forming bars in galaxies with M* > 1010 M⊙ (Sect. 3.4) reported by Fraser-McKelvie et al. (2020). This is seen both in FUV and in Hα (∼40% smaller sample); however, ∼1/2 of the analyzed galaxies in the Hα sample with 1010 M⊙ < M* < 1011 M⊙ belong to SF class C. Among the most massive galaxies, physical processes other than SF, such as gas shocks, can also account for the Hα emission. Neumann et al. (2019) used a sample of 16 galaxies (with M* ≳ 1010 M⊙) from the Close AGN Reference Survey (CARS; Husemann et al. 2017) to study the properties of star-forming bars and non-star-forming bars using IFU MUSE data, and report that the SF along the bar is linked to the flatness of the surface brightness profile: the flattest bars are star-forming. The latter is not easy to reconcile with our report of a low fraction of SF bars in early-type galaxies (see also Fraser-McKelvie et al. 2020), which typically host flat bars (e.g. Elmegreen & Elmegreen 1985; Elmegreen et al. 1996; Kim et al. 2015; Díaz-García et al. 2016b). This may be due to our use of a different and larger sample, and thus further analysis is needed.
Galaxies of T-types 0 ≤ T < 5, which are characterized by intermediate gas fractions and gravitational torques, predominantly have SF regions at the bar ends, but not along the bar. As discussed by Fraser-McKelvie et al. (2020), the occurrence of intense Hα at the bar ends has been postulated to be a consequence of the gas flows and shear at the kpc level, and cloud-cloud collisions and turbulence on a parsec scale (Renaud et al. 2015). These favorable physical conditions are likely to be present in early- and intermediate-type spirals. This trait is in principle not related to ansae structure (stellar blobs at the end of the bars; Danby 1965) since most ansae are detected in early-type galaxies (e.g., Laurikainen et al. 2007). However, recent work by Buta (2019) reports the detection of blue bar ansae in late-type galaxies, which could indeed be related to some of the UV enhancements (SF class B) characterized in this work or to highly oval star-forming inner rings. Martinez-Valpuesta et al. (2007) argue that the nature of this ansae structure is in principle stellar dynamical in origin, yet one example of an ansae harboring SF is reported (NGC 4151).
The likelihood of a bar to host SF is correlated with the total relative content of H I gas (Sect. 3.5), which is explained by the behavior of SF classes in the Hubble sequence. However, the availability of gas is not sufficient to explain the statistical trends: quite a few early- and intermediate-type spirals have plenty of cold gas and host H II regions everywhere except the bar where dynamical conditions must be different. Galaxies with T ≥ 5 are known to be dark matter dominated within the optical disk (see Fig. 6 in Díaz-García et al. 2016a); thus, the distinct disk stability properties and the interplay between dark matter, disk temperature, and SF must play a role to explain our observations.
Last but not least, one important ingredient that is missing from our analysis is the content of molecular gas. Ideally, we should use observations of the CO(1–0) line (115 GHz) and infer H2 gas masses from the velocity-integrated line intensities across the bars (e.g., Regan et al. 1999; Pan et al. 2015; George et al. 2019; Maeda et al. 2020), but such data are scarce for our large galaxy sample. In future work (Díaz-García et al., in prep.) we will study the relationship between the molecular gas column density and the surface density of the SFR (derived from GALEX UV and Hα imaging compiled in this work, correcting for extinction using 22 μm WISE photometry) s for a subsample of S4G galaxies, using the CO emission along the bars observed with the IRAM-30 m single dish.
4.6. Bars in late-type galaxies: resolution and non-stellar contaminants
Gas-rich galaxies often host clumpy bars (e.g., NGC 3023 in Fig. 10) and low-quality imaging and the consequent blurring of SF regions can lead to a missclassification of bars among the latest types (e.g., Sheth 2014), even at near-IR wavelengths, but this is not expected to be severe in the S4G given the good quality of the data (see, e.g., discussion in Buta et al. 2015). It is worth noting, however, that non-stellar emission (hot dust, polycyclic aromatic hydrocarbons, or asymptotic giant and red super-giant stars) can contaminate the 3.6 μm flux (Meidt et al. 2014; Querejeta et al. 2015). This can cast doubt on whether there is actually an underlying bar pattern in the old stellar populations of some late-type galaxies, i.e., whether self-gravity can alone make SF clumps aligning without presence of x1 orbits characterizing bars. While this might be the case for some bars, we argue that this does not explain the general picture for bars in late-type galaxies (see discussion and observational characterization of bars in late-type galaxies in, e.g., Díaz-García et al. 2016b).
Non-stellar contaminants could also contribute to the greater FUV and NUV emission in strong bars (Sect. 2.1), as seen in bar stacks comprising late-type galaxies. In other words, the visual identification of strong bars in 3.6 μm images of clumpy gas-rich galaxies can be biased due to the contribution of non-stellar emission at the bar region (for the analysis of the impact of non-stellar contaminant on bar forcing, see Appendix C in Díaz-García et al. 2016a). We also checked that our assignment of SF classes is not affected by the resolution of the employed imaging: the distribution of SF classes is uncorrelated with sizes of bars in pixels.
4.7. Gas inflow slowed down at the 1/4 ultraharmonic resonance
Many rings present recent SF and host young stars (Buta & Crocker 1993; Knapen et al. 1995; James et al. 2009). However, rings lacking SF activity have also been found (e.g., Buta & Crocker 1991; Comerón 2013). Grouchy et al. (2010) used a sample of 44 galaxies (26 non-barred or weakly barred, and 18 strongly barred) to show that the SFR within rings does not depend on the amplitude of the non-axisymmetric perturbation strength. More recently, Neumann et al. (2019) report a correlation between the lack of SF in a bar and the presence of an inner ring. This suggests that gas is caught in inner resonance rings (that tend to live at the 1/4 ultraharmonic resonance; e.g., Sellwood & Wilkinson 1993; Rautiainen & Salo 2000; Díaz-García et al. 2019b) and is prevented from funneling towards the center; this hypothesis is tested and discussed here.
Buta et al. (2015) identified 73 galaxies with inner rings and 268 with inner pseudo-rings (i.e., made of tightly wrapped spiral arms) in our sample of barred galaxies. Of the 73 galaxies with closed inner rings and available imaging (Sect. 3.2), only 20.5 ± 6.1% and 18.5 ± 4.8% belong to class C (SF-bar) in the Hα and FUV samples, respectively, which is much lower than the overall frequency of SF class C (∼50%) of the parent sample.
The lower fraction of star-forming bars in galaxies with inner rings is qualitatively in agreement with the reports by Neumann et al. (2019), whose subsample of four inner-ringed galaxies host non-star-forming bars. This can however be a consequence of inner rings living in massive galaxies (e.g., Díaz-García et al. 2019b) where the suppression of SF in bars is greatest (Sect. 3.4). Fraser-McKelvie et al. (2020) also report that inner rings in Hα maps are mainly detected in galaxies with total stellar masses higher than 1010 M⊙, which is not surprising as this is the M*-threshold where the fraction of rings (as detected at near-IR wavelengths) starts to rise (e.g., Herrera-Endoqui et al. 2015; Díaz-García et al. 2019b). On the other hand, we checked and confirmed that the inclusion of pseudorings makes the connection between SF in bars and presence of inner rings less clear: the fraction of inner-ringed galaxies with SF class C becomes 43 ± 3.4% (Hα) and 42.6 ± 2.8% (FUV); this may be explained by the fact that many pseudorings do not have a resonance origin (and hence trap less gas) or are hosted by late-type galaxies (with SF bars).
In addition, part of the picture above is also consistent with our findings in Sect. 2.2, in which we studied the mean UV radial profiles for galaxies hosting inner rings, normalized to the ring SMA. The radial distribution of SF relative to the inner ring loci is similar for barred and non-barred galaxies. We confirmed the inner dip in the UV emission for the subsample of barred galaxies hosting inner rings. Interestingly, this lack of UV emission is also detected in non-barred ringed galaxies, which are not expected to have their SF strongly suppressed in their central regions (as shown in Figs. 6 and E.2). That is, SF is on average suppressed at radii smaller than the inner ring SMA, irrespective of the presence of a bar.
Passive rings (i.e., lacking SF) are found only in early-type disk galaxies (−3 ≤ T ≤ 2), with a large fraction corresponding to ringlenses (30 − 40%) (Comerón 2013). We updated the classifications by Comerón (2013) (Sect. 3.2) and confirm his results (Fig. C.1) by including the new Hα images of barred galaxies from Sect. 3.1, showing that passive rings are mainly hosted by lenticular galaxies, in which the fraction of active rings is ≲50%. Naturally, this is a consequence of passive rings being hosted by galaxies with low relative contents of H I gas, as shown in Fig. C.2.
Curiously enough, there are a number of late-type galaxies (T ≥ 5) hosting passive rings as well, two in FUV (NGC 3389 and NGC 3906) and six in Hα (NGC 3906, NGC 4504, NGC 7437, UGC 04867, UGC 09245, and UGC 10791). It is also interesting that 16 barred galaxies in our sample host inner rings that are passive in Hα but not in FUV. As discussed in Comerón (2013), it is possible to infer quenching timescales on the order of 20–100 Myr from rings presenting FUV emission (tracing SF up to 100 Myr), but not Hα (tracing SF up to 20 Myr) (Kennicutt 1998). In particular, Comerón (2013) estimated 200 Myr to be a lower bound for the dissolution timescale of inner rings (on the order of one orbital period at the ring SMA).
We conclude that the gas funneled by non-axisymmetries, such as spiral arms, gets partially trapped at the inner rings. The gas no longer migrates to the nuclear regions, explaining the diminished UV and Hα emission within the rings’ SMA and along the bar. Nevertheless, the fact that a peak of UV and Hα emission is still detected in the circumnuclear regions implies that the presence of inner rings does not control circumnuclear SF, nourished by gas reservoirs accumulated for several (hundreds of) Myr.
5. Summary and conclusions
The main goals of this study are to shed light on the role of galactic bars regulating the SF activity across disks, and to link the distribution of SF in bars to the global properties of the host galaxies. With unprecedented statistical significance, we studied the spatial distribution of SF regions in the inner parts of more than 800 nearby disk galaxies (within ∼40 Mpc) with inclinations lower than 65°, drawn from the S4G survey (Sheth et al. 2010). Two complementary methods were used:
-
1.
We applied the stacking techniques developed in Díaz-García et al. (2016b) to GALEX NUV and FUV imaging from the GALEX/S4G Surface Brightness and Color Profiles Catalog (Bouquin et al. 2018). Prior to averaging, subsamples were defined based on global physical properties such as total stellar mass (M*), Hubble stage (T), and morphological family. (a) Bar stacks (2D) were built from co-added UV images (Figs. 1 and D.1) that were uniformly scaled and re-oriented with respect to the stellar bars, using bar parameters at 3.6 μm from Herrera-Endoqui et al. (2015) and Díaz-García et al. (2016a). The winding direction of the spiral arms was also systematically corrected to differentiate the leading and trailing sides of the bar. (b) UV luminosity profiles were scaled to a common framework defined by the extent of the disks in physical units (and that of the sizes of inner rings) followed by the calculation of the radial 1D average and dispersion (Figs. 4, 5, and 7), so that we could study differences in SF between barred and non-barred galaxies (Fig. 6).
-
2.
We classified the spatial distribution of SF regions by visually inspecting Hα and GALEX FUV images. Our classification system devises three main categories (Table 1), namely: – SF class A: only circumnuclear SF (accounting for ∼1/8 of the galaxies in our sample) (Fig. 8), – SF class B: SF at the bars ends, but not along the bar (∼1/4 of the sample) (Fig. 9), – SF class C: SF along the bar (∼1/2 of the sample) (Fig. 10). For this purpose, we assembled the largest compilation of continuum-subtracted Hα images in the S4G, comprising 433 galaxies (see Table A.1), and made them publicly available (via CDS). For 70 galaxies, we processed the continuum-subtraction ourselves from archival imaging and integral field unit datacubes (e.g., from the CALIFA and ESO archives).
The main results of this paper are the following:
-
Among massive galaxies with M* > 1010 M⊙ (typically S0/a-Sbc), barred galaxies are characterized by a dip in the radial distribution of SF that is not seen in non-barred systems (see also James et al. 2009) (Figs. 4, 6, and E.2). This shows that bars are loci of SF suppression, quite plausibly because of the combined effect of gas flows and shear (e.g., Renaud et al. 2015).
-
The UV emission traces the stellar bars and mainly appears on their leading side of the bar stacks in spiral galaxies (S0a-Sdm) (Fig. 1). This is in agreement with the expectation from numerical models (e.g., Athanassoula 1992a).
-
By studying individual galaxies we show that the distributions of SF classes A, B, and C are significantly different in the Hubble sequence. Whether a bar is star-forming or passive is likewise linked to global physical properties of the host galaxies (Figs. 11–14).
-
In particular, massive, gas-poor, S0 galaxies tend to host SF exclusively in the circumnuclear regions (category A), which is probably linked to the role of bars in galaxy quenching postulated from studies at high-z (e.g., Gavazzi et al. 2015b) and simulations (e.g., Khoperskov et al. 2018).
-
The SF in late-type galaxies (Sc-Im) is evenly distributed along the bar major-axis. The UV emission is on average higher at all bar radii among strong bars, relative to their weakly barred counterparts (Figs. 3 and E.1). The fraction of star-forming bars (class C) is larger for later morphological types, larger H I gas fractions, and higher tangential-to-radial force ratios, at both Hα and UV wavelengths. We argue that shear has the smallest effect in these late-type galaxies, favoring SF (e.g., Seigar 2005).
-
The SF activity dominates at the bar ends and the circumnuclear regions in bar stacks comprising galaxies of morphological types ranging between S0/a and Sbc (Fig. 2). The UV emission gets weaker, relative to the outer exponential disk, in the intermediate parts of the bar. We confirm that SF class B) is typical of early- and intermediate-type spirals (Fig. 11), with distributions of gas fraction (Fig. 13) and torque parameter (Fig. 14) that peak between those of classes A and C, likely due to a higher shear in galaxies with larger central mass concentrations and bar amplitudes.
-
Strongly barred early-type spiral galaxies are characterized by a ∼0.5 mag brighter central UV emission (Figs. 3 and E.1) (i.e., ≳50% larger ΣSFR), compared to their weakly barred counterparts (that show a somewhat higher UV emission in the middle and end parts of the bar). These observations can be explained by the effect of the bar-induced gravitational torques sweeping the gas in the disk that eventually fuels starbursts in the central regions (e.g., Sellwood & Wilkinson 1993).
-
In galaxies hosting inner rings, the mean radial UV luminosity profiles are similar for barred and non-barred galaxies. They show a local maximum close to the ring SMA, diminished UV emission in the region 0.3–0.7 SMA, and a nuclear peak (Fig. 7). This can be explained by gas being partially trapped at the 1/4 ultraharmonic resonance (Schwarz 1984; Buta & Combes 1996), causing a halt in its migration to the nuclear regions, irrespective of the presence of a bar.
-
The latter is further supported by the low fraction (< 1/3) of galaxies with closed inner rings belonging to class C. We also confirm that, while most inner rings detected at 3.6 μm are active in FUV and Hα passbands, the frequency of passive rings is highest among S0s, accounting for > 50% (Comerón 2013).
This work highlights the connection between bars and SF activity in the central parts of local disk galaxies, using an unprecedentedly large unbiased sample based on the analysis of GALEX UV and continuum-subtracted Hα imaging. Differences in the typical spatial distribution of SF in galactic bars are dependent on physical and morphological global properties of the host galaxies. We encourage these trends to be further studied elsewhere with numerical models.
Díaz-García et al. (2016a,b) showed a correspondence between visual (AB/AB/AB/B, from Buta et al. 2015) and quantitative estimates (tangential-to-radial forces, normalized m = 2 Fourier amplitudes, intrinsic ellipticity) of the bar strength.
M* was derived by Muñoz-Mateos et al. (2015) from 3.6 μm imaging using the calibration of the mass-to-light ratio by Eskew et al. (2012).
For a recent analysis of the dependence on M* of bar-induced radial distribution of metals in the gas phase of spirals, see Zurita et al. (2020a,b, and references therein).
Acknowledgments
We thank the anonymous referee for comments that improved this paper. We thank Stéphane Courteau, Jesús Falcón-Barroso, Estrella Florido, Ryan Leaman, Ute Lisenfeld, Isabel Pérez, Glenn van de Ven, Simon Verley, and Almudena Zurita for useful discussions. We thank Serafim Kaisin for providing continuum-subtracted Hα images for the galaxies NGC 3384, UGC 07257, and UGC 07534. This project has received funding from the European Union’s Horizon 2020 research and innovation programme under the Marie Sk ł odowska-Curie grant agreement No 893673. SDG acknowledges support from the Spanish Public Employment Service (SEPE). We acknowledge financial support from the European Union’s Horizon 2020 research and innovation programme under Marie Sk ł odowska-Curie grant agreement No 721463 to the SUNDIAL ITN network, from the State Research Agency (AEI-MCINN) of the Spanish Ministry of Science and Innovation under the grant “The structure and evolution of galaxies and their central regions” with reference PID2019-105602GB-I00/10.13039/501100011033, and from the IAC project P/300724 which is financed by the Ministry of Science and Innovation, through the State Budget and by the Canary Islands Department of Economy, Knowledge and Employment, through the Regional Budget of the Autonomous Community. AYKB acknowledges financial support from the Spanish Ministry of Economy and Competitiveness (MINECO), project Estallidos AYA2016-79724-C4-2-P. This research makes use of IDL (https://www.harrisgeospatial.com/docs/using_idl_home.html), python (http://www.python.org), Matplotlib (Hunter 2007), and Astropy (Astropy Collaboration 2013, 2018). Facilities: GALEX, Spitzer (IRAC).
References
- Aguerri, J. A. L. 1999, A&A, 351, 43 [NASA ADS] [Google Scholar]
- Aguerri, J. A. L., Méndez-Abreu, J., & Corsini, E. M. 2009, A&A, 495, 491 [NASA ADS] [CrossRef] [EDP Sciences] [Google Scholar]
- Astropy Collaboration (Robitaille, T. P., et al.) 2013, A&A, 558, A33 [NASA ADS] [CrossRef] [EDP Sciences] [Google Scholar]
- Astropy Collaboration (Price-Whelan, A. M., et al.) 2018, AJ, 156, 123 [Google Scholar]
- Athanassoula, E. 1992a, MNRAS, 259, 345 [NASA ADS] [CrossRef] [Google Scholar]
- Athanassoula, E. 1992b, MNRAS, 259, 328 [NASA ADS] [CrossRef] [Google Scholar]
- Athanassoula, E. 2012, MNRAS, 426, L46 [NASA ADS] [Google Scholar]
- Athanassoula, E. 2013, in Bars and Secular Evolution in Disk Galaxies: Theoretical Input, eds. J. Falcón-Barroso, & J. H. Knapen, 305 [CrossRef] [Google Scholar]
- Athanassoula, E., & Misiriotis, A. 2002, MNRAS, 330, 35 [NASA ADS] [CrossRef] [Google Scholar]
- Athanassoula, E., Machado, R. E. G., & Rodionov, S. A. 2013, MNRAS, 429, 1949 [NASA ADS] [CrossRef] [Google Scholar]
- Bacon, R., Accardo, M., Adjali, L., et al. 2010, in Proc. SPIE, SPIE Conf. Ser., 7735, 773508 [Google Scholar]
- Baldwin, J. A., Phillips, M. M., & Terlevich, R. 1981, PASP, 93, 5 [NASA ADS] [CrossRef] [EDP Sciences] [Google Scholar]
- Bianchi, L., Shiao, B., & Thilker, D. 2017, ApJS, 230, 24 [NASA ADS] [CrossRef] [Google Scholar]
- Block, D. L., Puerari, I., Knapen, J. H., et al. 2001, A&A, 375, 761 [NASA ADS] [CrossRef] [EDP Sciences] [Google Scholar]
- Böker, T., Calzetti, D., Sparks, W., et al. 1999, ApJS, 124, 95 [NASA ADS] [CrossRef] [Google Scholar]
- Boselli, A., Fossati, M., Gavazzi, G., et al. 2015, A&A, 579, A102 [NASA ADS] [CrossRef] [EDP Sciences] [Google Scholar]
- Boselli, A., Epinat, B., Contini, T., et al. 2019, A&A, 631, A114 [NASA ADS] [CrossRef] [EDP Sciences] [Google Scholar]
- Bouquin, A. Y. K., Gil de Paz, A., Boissier, S., et al. 2015, ApJ, 800, L19 [CrossRef] [Google Scholar]
- Bouquin, A. Y. K., Gil de Paz, A., Muñoz-Mateos, J. C., et al. 2018, ApJS, 234, 18 [NASA ADS] [CrossRef] [Google Scholar]
- Bundy, K., Bershady, M. A., Law, D. R., et al. 2015, ApJ, 798, 7 [NASA ADS] [CrossRef] [Google Scholar]
- Buta, R. J. 2019, MNRAS, 488, 590 [CrossRef] [Google Scholar]
- Buta, R., & Block, D. L. 2001, ApJ, 550, 243 [NASA ADS] [CrossRef] [Google Scholar]
- Buta, R., & Combes, F. 1996, Fundam. Cosmic Phys., 17, 95 [NASA ADS] [Google Scholar]
- Buta, R., & Crocker, D. A. 1991, AJ, 102, 1715 [NASA ADS] [CrossRef] [Google Scholar]
- Buta, R., & Crocker, D. A. 1993, AJ, 105, 1344 [NASA ADS] [CrossRef] [Google Scholar]
- Buta, R. J., Sheth, K., Athanassoula, E., et al. 2015, ApJS, 217, 32 [NASA ADS] [CrossRef] [Google Scholar]
- Catalán-Torrecilla, C., Gil de Paz, A., Castillo-Morales, A., et al. 2017, ApJ, 848, 87 [NASA ADS] [CrossRef] [Google Scholar]
- Cenarro, A. J., Moles, M., Cristóbal-Hornillos, D., et al. 2019, A&A, 622, A176 [NASA ADS] [CrossRef] [EDP Sciences] [Google Scholar]
- Cheung, E., Athanassoula, E., Masters, K. L., et al. 2013, ApJ, 779, 162 [NASA ADS] [CrossRef] [Google Scholar]
- Cisternas, M., Gadotti, D. A., Knapen, J. H., et al. 2013, ApJ, 776, 50 [NASA ADS] [CrossRef] [Google Scholar]
- Coelho, P., & Gadotti, D. A. 2011, ApJ, 743, L13 [NASA ADS] [CrossRef] [Google Scholar]
- Collier, A., Shlosman, I., & Heller, C. 2019, MNRAS, 488, 5788 [CrossRef] [Google Scholar]
- Combes, F., & Gerin, M. 1985, A&A, 150, 327 [NASA ADS] [Google Scholar]
- Combes, F., & Sanders, R. H. 1981, A&A, 96, 164 [NASA ADS] [Google Scholar]
- Comerón, S. 2013, A&A, 555, L4 [NASA ADS] [CrossRef] [EDP Sciences] [Google Scholar]
- Comerón, S., Knapen, J. H., & Beckman, J. E. 2008, A&A, 485, 695 [NASA ADS] [CrossRef] [EDP Sciences] [Google Scholar]
- Comerón, S., Knapen, J. H., Beckman, J. E., et al. 2010, MNRAS, 402, 2462 [NASA ADS] [CrossRef] [Google Scholar]
- Comerón, S., Salo, H., Laurikainen, E., et al. 2014, A&A, 562, A121 [NASA ADS] [CrossRef] [EDP Sciences] [Google Scholar]
- Dale, D. A., Cohen, S. A., Johnson, L. C., et al. 2009, ApJ, 703, 517 [NASA ADS] [CrossRef] [Google Scholar]
- Danby, J. M. A. 1965, AJ, 70, 501 [NASA ADS] [CrossRef] [Google Scholar]
- de Lorenzo-Cáceres, A., Vazdekis, A., Aguerri, J. A. L., Corsini, E. M., & Debattista, V. P. 2012, MNRAS, 420, 1092 [NASA ADS] [CrossRef] [Google Scholar]
- de Lorenzo-Cáceres, A., Falcón-Barroso, J., & Vazdekis, A. 2013, MNRAS, 431, 2397 [NASA ADS] [CrossRef] [Google Scholar]
- de Lorenzo-Cáceres, A., Sánchez-Blázquez, P., Méndez-Abreu, J., et al. 2019, MNRAS, 484, 5296 [CrossRef] [Google Scholar]
- de Vaucouleurs, G. 1963, ApJS, 8, 31 [NASA ADS] [CrossRef] [Google Scholar]
- de Vaucouleurs, G., & de Vaucouleurs, A. 1963, AJ, 68, 278 [NASA ADS] [CrossRef] [Google Scholar]
- Devereux, N. 1987, ApJ, 323, 91 [NASA ADS] [CrossRef] [Google Scholar]
- Díaz-García, S., & Knapen, J. H. 2020, A&A, 635, A197 [CrossRef] [EDP Sciences] [Google Scholar]
- Díaz-García, S., Salo, H., Laurikainen, E., & Herrera-Endoqui, M. 2016a, A&A, 587, A160 [NASA ADS] [CrossRef] [EDP Sciences] [Google Scholar]
- Díaz-García, S., Salo, H., & Laurikainen, E. 2016b, A&A, 596, A84 [NASA ADS] [CrossRef] [EDP Sciences] [Google Scholar]
- Díaz-García, S., Salo, H., Knapen, J. H., & Herrera-Endoqui, M. 2019a, A&A, 631, A94 [NASA ADS] [CrossRef] [EDP Sciences] [Google Scholar]
- Díaz-García, S., Díaz-Suárez, S., Knapen, J. H., & Salo, H. 2019b, A&A, 625, A146 [NASA ADS] [CrossRef] [EDP Sciences] [Google Scholar]
- Domínguez Sánchez, H., Huertas-Company, M., Bernardi, M., Tuccillo, D., & Fischer, J. L. 2018, MNRAS, 476, 3661 [NASA ADS] [CrossRef] [Google Scholar]
- Donohoe-Keyes, C. E., Martig, M., James, P. A., & Kraljic, K. 2019, MNRAS, 489, 4992 [CrossRef] [Google Scholar]
- Dressel, L. L. 1988, ApJ, 329, L69 [NASA ADS] [CrossRef] [Google Scholar]
- Ellison, S. L., Nair, P., Patton, D. R., et al. 2011, MNRAS, 416, 2182 [NASA ADS] [CrossRef] [Google Scholar]
- Elmegreen, B. G., & Elmegreen, D. M. 1985, ApJ, 288, 438 [NASA ADS] [CrossRef] [Google Scholar]
- Elmegreen, B. G., Elmegreen, D. M., & Seiden, P. E. 1989, ApJ, 343, 602 [NASA ADS] [CrossRef] [Google Scholar]
- Elmegreen, B. G., Elmegreen, D. M., Chromey, F. R., Hasselbacher, D. A., & Bissell, B. A. 1996, AJ, 111, 2233 [NASA ADS] [CrossRef] [Google Scholar]
- Emsellem, E., Renaud, F., Bournaud, F., et al. 2015, MNRAS, 446, 2468 [NASA ADS] [CrossRef] [Google Scholar]
- Epinat, B., Amram, P., Marcelin, M., et al. 2008, MNRAS, 388, 500 [NASA ADS] [CrossRef] [Google Scholar]
- Erroz-Ferrer, S., Knapen, J. H., Leaman, R., et al. 2016, MNRAS, 458, 1199 [NASA ADS] [CrossRef] [Google Scholar]
- Erroz-Ferrer, S., Carollo, C. M., den Brok, M., et al. 2019, MNRAS, 484, 5009 [NASA ADS] [CrossRef] [Google Scholar]
- Erwin, P. 2018, MNRAS, 474, 5372 [NASA ADS] [CrossRef] [Google Scholar]
- Erwin, P. 2019, MNRAS, 489, 3553 [CrossRef] [Google Scholar]
- Erwin, P., & Sparke, L. S. 2002, AJ, 124, 65 [NASA ADS] [CrossRef] [Google Scholar]
- Eskew, M., Zaritsky, D., & Meidt, S. 2012, AJ, 143, 139 [NASA ADS] [CrossRef] [Google Scholar]
- Florido, E., Zurita, A., Pérez, I., et al. 2015, A&A, 584, A88 [NASA ADS] [CrossRef] [EDP Sciences] [Google Scholar]
- Fragkoudi, F., Athanassoula, E., & Bosma, A. 2016, MNRAS, 462, L41 [NASA ADS] [CrossRef] [Google Scholar]
- Fraser-McKelvie, A., Merrifield, M., Aragón-Salamanca, A., et al. 2019, MNRAS, 488, L6 [CrossRef] [Google Scholar]
- Fraser-McKelvie, A., Aragón-Salamanca, A., Merrifield, M., et al. 2020, MNRAS, 495, 4158 [CrossRef] [Google Scholar]
- Freudling, W., Romaniello, M., Bramich, D. M., et al. 2013, A&A, 559, A96 [NASA ADS] [CrossRef] [EDP Sciences] [Google Scholar]
- Friedli, D., & Benz, W. 1993, A&A, 268, 65 [NASA ADS] [Google Scholar]
- Fujii, M. S., Bédorf, J., Baba, J., & Portegies Zwart, S. 2018, MNRAS, 477, 1451 [NASA ADS] [CrossRef] [Google Scholar]
- Gadotti, D. A., Seidel, M. K., Sánchez-Blázquez, P., et al. 2015, A&A, 584, A90 [NASA ADS] [CrossRef] [EDP Sciences] [Google Scholar]
- Gadotti, D. A., Sánchez-Blázquez, P., Falcón-Barroso, J., et al. 2019, MNRAS, 482, 506 [Google Scholar]
- Galbany, L., Anderson, J. P., Sánchez, S. F., et al. 2018, ApJ, 855, 107 [NASA ADS] [CrossRef] [Google Scholar]
- García-Barreto, J. A., Franco, J., Carrillo, R., Venegas, S., & Escalante-Ramírez, B. 1996, Rev. Mex. Astron. Astrofis., 32, 89 [NASA ADS] [Google Scholar]
- Gavazzi, G., Boselli, A., Donati, A., Franzetti, P., & Scodeggio, M. 2003, A&A, 400, 451 [NASA ADS] [CrossRef] [EDP Sciences] [Google Scholar]
- Gavazzi, G., Fumagalli, M., Galardo, V., et al. 2012, A&A, 545, A16 [NASA ADS] [CrossRef] [EDP Sciences] [Google Scholar]
- Gavazzi, G., Franzetti, P., & Boselli, A. 2014, ArXiv e-prints [arXiv:1401.8123] [Google Scholar]
- Gavazzi, G., Consolandi, G., Viscardi, E., et al. 2015a, A&A, 576, A16 [NASA ADS] [CrossRef] [EDP Sciences] [Google Scholar]
- Gavazzi, G., Consolandi, G., Dotti, M., et al. 2015b, A&A, 580, A116 [NASA ADS] [CrossRef] [EDP Sciences] [Google Scholar]
- Gavazzi, G., Consolandi, G., Pedraglio, S., et al. 2018, A&A, 611, A28 [NASA ADS] [CrossRef] [EDP Sciences] [Google Scholar]
- George, K., Joseph, P., Mondal, C., et al. 2019, A&A, 621, L4 [NASA ADS] [CrossRef] [EDP Sciences] [Google Scholar]
- Gil de Paz, A., Madore, B. F., & Pevunova, O. 2003, ApJS, 147, 29 [NASA ADS] [CrossRef] [Google Scholar]
- Gil de Paz, A., Boissier, S., Madore, B. F., et al. 2007, ApJS, 173, 185 [Google Scholar]
- Giovanelli, R., & Haynes, M. P. 1988, in Extragalactic Neutral Hydrogen, eds. K. I. Kellermann, & G. L. Verschuur, 522 [Google Scholar]
- Grouchy, R. D., Buta, R. J., Salo, H., & Laurikainen, E. 2010, AJ, 139, 2465 [NASA ADS] [CrossRef] [Google Scholar]
- Gunn, J. E., Siegmund, W. A., Mannery, E. J., et al. 2006, AJ, 131, 2332 [NASA ADS] [CrossRef] [Google Scholar]
- Hameed, S., & Devereux, N. 1999, AJ, 118, 730 [NASA ADS] [CrossRef] [Google Scholar]
- Hao, L., Jogee, S., Barazza, F. D., Marinova, I., & Shen, J. 2009, in Galaxy Evolution: Emerging Insights and Future Challenges, eds. S. Jogee, I. Marinova, L. Hao, & G. A. Blanc, ASP Conf. Ser., 419, 402 [Google Scholar]
- Hawarden, T. G., Mountain, C. M., Leggett, S. K., & Puxley, P. J. 1986, MNRAS, 221, 41P [NASA ADS] [CrossRef] [Google Scholar]
- Haynes, M. P., Giovanelli, R., Martin, A. M., et al. 2011, AJ, 142, 170 [NASA ADS] [CrossRef] [Google Scholar]
- Heckman, T. M. 1980, A&A, 88, 365 [NASA ADS] [Google Scholar]
- Heller, C. H., & Shlosman, I. 1994, ApJ, 424, 84 [NASA ADS] [CrossRef] [Google Scholar]
- Herrera-Endoqui, M., Díaz-García, S., Laurikainen, E., & Salo, H. 2015, A&A, 582, A86 [NASA ADS] [CrossRef] [EDP Sciences] [Google Scholar]
- Hilmi, T., Minchev, I., Buck, T., et al. 2020, MNRAS, 497, 933 [CrossRef] [Google Scholar]
- Hoopes, C. G., Walterbos, R. A. M., & Bothun, G. D. 2001, ApJ, 559, 878 [NASA ADS] [CrossRef] [Google Scholar]
- Hummel, E. 1981, A&A, 93, 93 [NASA ADS] [Google Scholar]
- Hunter, J. D. 2007, Inst. Electr. Electron. Eng., 9, 90 [Google Scholar]
- Hunter, D. A., & Elmegreen, B. G. 2004, AJ, 128, 2170 [NASA ADS] [CrossRef] [Google Scholar]
- Husemann, B., Tremblay, G., Davis, T., et al. 2017, The Messenger, 169, 42 [NASA ADS] [Google Scholar]
- Iodice, E., Sarzi, M., Bittner, A., et al. 2019, A&A, 627, A136 [NASA ADS] [CrossRef] [EDP Sciences] [Google Scholar]
- James, P. A., & Percival, S. M. 2016, MNRAS, 457, 917 [NASA ADS] [CrossRef] [Google Scholar]
- James, P. A., & Percival, S. M. 2018, MNRAS, 474, 3101 [NASA ADS] [CrossRef] [Google Scholar]
- James, P. A., Shane, N. S., Beckman, J. E., et al. 2004, A&A, 414, 23 [NASA ADS] [CrossRef] [EDP Sciences] [Google Scholar]
- James, P. A., Bretherton, C. F., & Knapen, J. H. 2009, A&A, 501, 207 [NASA ADS] [CrossRef] [EDP Sciences] [Google Scholar]
- Jedrzejewski, R. I. 1987, MNRAS, 226, 747 [Google Scholar]
- Jogee, S., Knapen, J. H., Laine, S., et al. 2002, ApJ, 570, L55 [NASA ADS] [CrossRef] [Google Scholar]
- Jogee, S., Scoville, N., & Kenney, J. D. P. 2005, ApJ, 630, 837 [NASA ADS] [CrossRef] [Google Scholar]
- Kaisin, S. S., & Karachentsev, I. D. 2006, Astrophysics, 49, 287 [CrossRef] [Google Scholar]
- Karachentsev, I. D., Kaisin, S. S., & Kaisina, E. I. 2015, Astrophysics, 58, 453 [CrossRef] [Google Scholar]
- Kennicutt, R. C., Jr 1989, ApJ, 344, 685 [NASA ADS] [CrossRef] [Google Scholar]
- Kennicutt, R. C., Jr 1998, ARA&A, 36, 189 [Google Scholar]
- Kennicutt, R. C., & Evans, N. J. 2012, ARA&A, 50, 531 [NASA ADS] [CrossRef] [Google Scholar]
- Kennicutt, R. C., Jr, Armus, L., Bendo, G., et al. 2003, PASP, 115, 928 [NASA ADS] [CrossRef] [Google Scholar]
- Khoperskov, S., Haywood, M., Di Matteo, P., Lehnert, M. D., & Combes, F. 2018, A&A, 609, A60 [NASA ADS] [CrossRef] [EDP Sciences] [Google Scholar]
- Kim, T., Sheth, K., Gadotti, D. A., et al. 2015, ApJ, 799, 99 [NASA ADS] [CrossRef] [Google Scholar]
- Knapen, J. H. 2004, in Fuelling Starbursts and AGN, eds. D. L. Block, I. Puerari, K. C. Freeman, R. Groess, & E. K. Block, Astrophys. Space Sci. Lib., 319, 189 [Google Scholar]
- Knapen, J. H. 2005, A&A, 429, 141 [NASA ADS] [CrossRef] [EDP Sciences] [Google Scholar]
- Knapen, J. H., Beckman, J. E., Heller, C. H., Shlosman, I., & de Jong, R. S. 1995, ApJ, 454, 623 [NASA ADS] [CrossRef] [Google Scholar]
- Knapen, J. H., Shlosman, I., & Peletier, R. F. 2000, ApJ, 529, 93 [NASA ADS] [CrossRef] [Google Scholar]
- Knapen, J. H., Stedman, S., Bramich, D. M., Folkes, S. L., & Bradley, T. R. 2004, A&A, 426, 1135 [NASA ADS] [CrossRef] [EDP Sciences] [Google Scholar]
- Knapen, J. H., Mazzuca, L. M., Böker, T., et al. 2006, A&A, 448, 489 [NASA ADS] [CrossRef] [EDP Sciences] [Google Scholar]
- Koopmann, R. A. 1997, Ph.D. Thesis, Yale University, USA [Google Scholar]
- Koopmann, R. A., & Kenney, J. D. P. 2006, ApJS, 162, 97 [NASA ADS] [CrossRef] [Google Scholar]
- Koopmann, R. A., Kenney, J. D. P., & Young, J. 2001, ApJS, 135, 125 [NASA ADS] [CrossRef] [Google Scholar]
- Kormendy, J. 2013, in Secular Evolution in Disk Galaxies, eds. J.Falcón-Barroso, & J. H.Knapen, 1 [Google Scholar]
- Kormendy, J., & Kennicutt, R. C., Jr 2004, ARA&A, 42, 603 [NASA ADS] [CrossRef] [Google Scholar]
- Kostiuk, I. P., & Sil’chenko, O. K. 2015, Baltic Astron., 24, 426 [Google Scholar]
- Kreckel, K., Ho, I. T., Blanc, G. A., et al. 2019, ApJ, 887, 80 [NASA ADS] [CrossRef] [Google Scholar]
- Krishnarao, D., Tremonti, C., Fraser-McKelvie, A., et al. 2020, ApJ, 898, 116 [CrossRef] [Google Scholar]
- Kroupa, P. 2001, MNRAS, 322, 231 [NASA ADS] [CrossRef] [Google Scholar]
- Kruk, S. J., Lintott, C. J., Bamford, S. P., et al. 2018, MNRAS, 473, 4731 [NASA ADS] [CrossRef] [Google Scholar]
- Kuncarayakti, H., Anderson, J. P., Galbany, L., et al. 2018, A&A, 613, A35 [NASA ADS] [CrossRef] [EDP Sciences] [Google Scholar]
- Laine, J., Laurikainen, E., & Salo, H. 2016, A&A, 596, A25 [NASA ADS] [CrossRef] [EDP Sciences] [Google Scholar]
- Larsen, S. S., & Richtler, T. 1999, A&A, 345, 59 [NASA ADS] [Google Scholar]
- Laurikainen, E., & Salo, H. 2002, MNRAS, 337, 1118 [NASA ADS] [CrossRef] [Google Scholar]
- Laurikainen, E., Salo, H., & Rautiainen, P. 2002, MNRAS, 331, 880 [NASA ADS] [CrossRef] [Google Scholar]
- Laurikainen, E., Salo, H., & Buta, R. 2004, ApJ, 607, 103 [NASA ADS] [CrossRef] [Google Scholar]
- Laurikainen, E., Salo, H., Buta, R., & Knapen, J. H. 2007, MNRAS, 381, 401 [NASA ADS] [CrossRef] [Google Scholar]
- Leaman, R., Fragkoudi, F., Querejeta, M., et al. 2019, MNRAS, 488, 3904 [CrossRef] [Google Scholar]
- Lee, G.-H., Woo, J.-H., Lee, M. G., et al. 2012, ApJ, 750, 141 [NASA ADS] [CrossRef] [Google Scholar]
- Lin, L., Li, C., He, Y., Xiao, T., & Wang, E. 2017, ApJ, 838, 105 [NASA ADS] [CrossRef] [Google Scholar]
- Lin, L., Li, C., Du, C., et al. 2020, MNRAS, 499, 1406 [CrossRef] [Google Scholar]
- López-Cobá, C., Sánchez, S. F., Anderson, J. P., et al. 2020, AJ, 159, 167 [CrossRef] [Google Scholar]
- Lyman, J. D., Taddia, F., Stritzinger, M. D., et al. 2018, MNRAS, 473, 1359 [NASA ADS] [CrossRef] [Google Scholar]
- Lyman, J. D., Galbany, L., Sánchez, S. F., et al. 2020, MNRAS, 495, 992 [CrossRef] [Google Scholar]
- Lynden-Bell, D. 1979, MNRAS, 187, 101 [Google Scholar]
- Madau, P., & Dickinson, M. 2014, ARA&A, 52, 415 [NASA ADS] [CrossRef] [Google Scholar]
- Maeda, F., Ohta, K., Fujimoto, Y., Habe, A., & Ushio, K. 2020, MNRAS, 495, 3840 [CrossRef] [Google Scholar]
- Marinova, I., & Jogee, S. 2007, ApJ, 659, 1176 [NASA ADS] [CrossRef] [Google Scholar]
- Martin, P., & Friedli, D. 1997, A&A, 326, 449 [NASA ADS] [Google Scholar]
- Martinez-Valpuesta, I., Knapen, J. H., & Buta, R. 2007, AJ, 134, 1863 [NASA ADS] [CrossRef] [Google Scholar]
- Masters, K. L., Nichol, R. C., Haynes, M. P., et al. 2012, MNRAS, 424, 2180 [NASA ADS] [CrossRef] [Google Scholar]
- Meidt, S. E., Schinnerer, E., van de Ven, G., et al. 2014, ApJ, 788, 144 [NASA ADS] [CrossRef] [Google Scholar]
- Mendes de Oliveira, C., Ribeiro, T., Schoenell, W., et al. 2019, MNRAS, 489, 241 [NASA ADS] [CrossRef] [Google Scholar]
- Méndez-Abreu, J., Sánchez-Janssen, R., Aguerri, J. A. L., Corsini, E. M., & Zarattini, S. 2012, ApJ, 761, L6 [NASA ADS] [CrossRef] [Google Scholar]
- Méndez-Abreu, J., Debattista, V. P., Corsini, E. M., & Aguerri, J. A. L. 2014, A&A, 572, A25 [NASA ADS] [CrossRef] [EDP Sciences] [Google Scholar]
- Méndez-Abreu, J., de Lorenzo-Cáceres, A., Gadotti, D. A., et al. 2019, MNRAS, 482, L118 [NASA ADS] [CrossRef] [Google Scholar]
- Menéndez-Delmestre, K., Sheth, K., Schinnerer, E., Jarrett, T. H., & Scoville, N. Z. 2007, ApJ, 657, 790 [NASA ADS] [CrossRef] [Google Scholar]
- Meurer, G. R., Hanish, D. J., Ferguson, H. C., et al. 2006, ApJS, 165, 307 [NASA ADS] [CrossRef] [Google Scholar]
- Minchev, I., Famaey, B., Combes, F., et al. 2011, A&A, 527, A147 [NASA ADS] [CrossRef] [EDP Sciences] [Google Scholar]
- Minchev, I., Famaey, B., Quillen, A. C., et al. 2012, A&A, 548, A126 [NASA ADS] [CrossRef] [EDP Sciences] [Google Scholar]
- Mingozzi, M., Cresci, G., Venturi, G., et al. 2019, A&A, 622, A146 [NASA ADS] [CrossRef] [EDP Sciences] [Google Scholar]
- Muñoz-Mateos, J. C., Sheth, K., Regan, M., et al. 2015, ApJS, 219, 3 [Google Scholar]
- Nair, P. B., & Abraham, R. G. 2010, ApJ, 714, L260 [NASA ADS] [CrossRef] [Google Scholar]
- Neumann, J., Gadotti, D. A., Wisotzki, L., et al. 2019, A&A, 627, A26 [CrossRef] [EDP Sciences] [Google Scholar]
- Neumann, J., Fragkoudi, F., Pérez, I., et al. 2020, A&A, 637, A56 [CrossRef] [EDP Sciences] [Google Scholar]
- Oh, S., Oh, K., & Yi, S. K. 2012, ApJS, 198, 4 [Google Scholar]
- Pan, H.-A., Kuno, N., Koda, J., et al. 2015, ApJ, 815, 59 [CrossRef] [Google Scholar]
- Pérez, I., & Sánchez-Blázquez, P. 2011, A&A, 529, A64 [NASA ADS] [CrossRef] [EDP Sciences] [Google Scholar]
- Pérez, I., Fux, R., & Freeman, K. 2004, A&A, 424, 799 [NASA ADS] [CrossRef] [EDP Sciences] [Google Scholar]
- Pérez, I., Sánchez-Blázquez, P., & Zurita, A. 2007, A&A, 465, L9 [NASA ADS] [CrossRef] [EDP Sciences] [Google Scholar]
- Pérez, I., Sánchez-Blázquez, P., & Zurita, A. 2009, A&A, 495, 775 [NASA ADS] [CrossRef] [EDP Sciences] [Google Scholar]
- Pérez, I., Martínez-Valpuesta, I., Ruiz-Lara, T., et al. 2017, MNRAS, 470, L122 [NASA ADS] [CrossRef] [Google Scholar]
- Persic, M., & Salucci, P. 1991, ApJ, 368, 60 [Google Scholar]
- Petersen, M. S., Weinberg, M. D., & Katz, N. 2016, MNRAS, 463, 1952 [CrossRef] [Google Scholar]
- Phillips, A. C. 1996, in IAU Colloq. 157: Barred Galaxies, eds. R.Buta, D. A. Crocker, & B. G. Elmegreen, ASP Conf. Ser., 91, 44 [Google Scholar]
- Popping, G., Pérez, I., & Zurita, A. 2010, A&A, 521, A8 [CrossRef] [EDP Sciences] [Google Scholar]
- Puxley, P. J., Hawarden, T. G., & Mountain, C. M. 1988, MNRAS, 231, 465 [NASA ADS] [CrossRef] [Google Scholar]
- Querejeta, M., Meidt, S. E., Schinnerer, E., et al. 2015, ApJS, 219, 5 [NASA ADS] [CrossRef] [Google Scholar]
- Rautiainen, P., & Salo, H. 2000, A&A, 362, 465 [NASA ADS] [Google Scholar]
- Regan, M. W., Sheth, K., & Vogel, S. N. 1999, ApJ, 526, 97 [NASA ADS] [CrossRef] [Google Scholar]
- Regan, M. W., Thornley, M. D., Vogel, S. N., et al. 2006, ApJ, 652, 1112 [NASA ADS] [CrossRef] [Google Scholar]
- Renaud, F., Bournaud, F., Emsellem, E., et al. 2015, MNRAS, 454, 3299 [NASA ADS] [CrossRef] [Google Scholar]
- Reynaud, D., & Downes, D. 1998, A&A, 337, 671 [NASA ADS] [Google Scholar]
- Romano, R., Mayya, Y. D., & Vorobyov, E. I. 2008, AJ, 136, 1259 [NASA ADS] [CrossRef] [Google Scholar]
- Rosales-Ortega, F. F. 2011, New A, 16, 220 [NASA ADS] [CrossRef] [Google Scholar]
- Ryder, S. D., & Dopita, M. A. 1993, ApJS, 88, 415 [NASA ADS] [CrossRef] [Google Scholar]
- Sakamoto, K., Okumura, S. K., Ishizuki, S., & Scoville, N. Z. 1999, ApJ, 525, 691 [NASA ADS] [CrossRef] [Google Scholar]
- Salo, H., & Laurikainen, E. 2017, ApJ, 835, 252 [NASA ADS] [CrossRef] [Google Scholar]
- Salo, H., Rautiainen, P., Buta, R., et al. 1999, AJ, 117, 792 [NASA ADS] [CrossRef] [Google Scholar]
- Salo, H., Laurikainen, E., Buta, R., & Knapen, J. H. 2010, ApJ, 715, L56 [NASA ADS] [CrossRef] [Google Scholar]
- Salo, H., Laurikainen, E., Laine, J., et al. 2015, ApJS, 219, 4 [NASA ADS] [CrossRef] [Google Scholar]
- Sánchez, S. F., Kennicutt, R. C., Gil de Paz, A., et al. 2012, A&A, 538, A8 [NASA ADS] [CrossRef] [EDP Sciences] [Google Scholar]
- Sánchez, S. F., García-Benito, R., Zibetti, S., et al. 2016, A&A, 594, A36 [NASA ADS] [CrossRef] [EDP Sciences] [Google Scholar]
- Sánchez-Blázquez, P., Ocvirk, P., Gibson, B. K., Pérez, I., & Peletier, R. F. 2011, MNRAS, 415, 709 [NASA ADS] [CrossRef] [Google Scholar]
- Sánchez-Blázquez, P., Rosales-Ortega, F. F., Méndez-Abreu, J., et al. 2014, A&A, 570, A6 [NASA ADS] [CrossRef] [EDP Sciences] [Google Scholar]
- Sánchez-Janssen, R., & Gadotti, D. A. 2013, MNRAS, 432, L56 [NASA ADS] [CrossRef] [Google Scholar]
- Schwarz, M. P. 1984, MNRAS, 209, 93 [NASA ADS] [CrossRef] [Google Scholar]
- Seidel, M. K., Falcón-Barroso, J., Martínez-Valpuesta, I., et al. 2015, MNRAS, 451, 936 [NASA ADS] [CrossRef] [Google Scholar]
- Seidel, M. K., Falcón-Barroso, J., Martínez-Valpuesta, I., et al. 2016, MNRAS, 460, 3784 [NASA ADS] [CrossRef] [Google Scholar]
- Seigar, M. S. 2005, MNRAS, 361, L20 [NASA ADS] [CrossRef] [Google Scholar]
- Seigar, M. S., Block, D. L., Puerari, I., Chorney, N. E., & James, P. A. 2005, MNRAS, 359, 1065 [NASA ADS] [CrossRef] [Google Scholar]
- Seigar, M. S., Bullock, J. S., Barth, A. J., & Ho, L. C. 2006, ApJ, 645, 1012 [NASA ADS] [CrossRef] [Google Scholar]
- Sellwood, J. A., & Wilkinson, A. 1993, Rep. Prog. Phys., 56, 173 [NASA ADS] [CrossRef] [Google Scholar]
- Shen, J., & Sellwood, J. A. 2004, ApJ, 604, 614 [NASA ADS] [CrossRef] [Google Scholar]
- Sheth, K., & S4G Team 2014, AAS Meeting Abstracts, #223, 205.02 [Google Scholar]
- Sheth, K., Vogel, S. N., Regan, M. W., et al. 2002, AJ, 124, 2581 [NASA ADS] [CrossRef] [Google Scholar]
- Sheth, K., Vogel, S. N., Regan, M. W., Thornley, M. D., & Teuben, P. J. 2005, ApJ, 632, 217 [NASA ADS] [CrossRef] [Google Scholar]
- Sheth, K., Elmegreen, D. M., Elmegreen, B. G., et al. 2008, ApJ, 675, 1141 [NASA ADS] [CrossRef] [Google Scholar]
- Sheth, K., Regan, M., Hinz, J. L., et al. 2010, PASP, 122, 1397 [NASA ADS] [CrossRef] [Google Scholar]
- Sheth, K., Armus, L., Athanassoula, E., et al. 2013, Not Dead Yet! Completing Spitzer’s Legacy with Early Type Galaxies, Spitzer Proposal [Google Scholar]
- Shlosman, I., Frank, J., & Begelman, M. C. 1989, Nature, 338, 45 [NASA ADS] [CrossRef] [Google Scholar]
- Simkin, S. M., Su, H. J., & Schwarz, M. P. 1980, ApJ, 237, 404 [NASA ADS] [CrossRef] [Google Scholar]
- Toomre, A. 1964, ApJ, 139, 1217 [Google Scholar]
- Torres-Flores, S., Amram, P., Mendes de Oliveira, C., et al. 2014, MNRAS, 442, 2188 [NASA ADS] [CrossRef] [Google Scholar]
- Vanhala, H. A. T., & Cameron, A. G. W. 1998, ApJ, 508, 291 [NASA ADS] [CrossRef] [Google Scholar]
- van Zee, L. 2000, AJ, 119, 2757 [NASA ADS] [CrossRef] [Google Scholar]
- Vera, M., Alonso, S., & Coldwell, G. 2016, A&A, 595, A63 [NASA ADS] [CrossRef] [EDP Sciences] [Google Scholar]
- Verley, S., Combes, F., Verdes-Montenegro, L., Bergond, G., & Leon, S. 2007a, A&A, 474, 43 [NASA ADS] [CrossRef] [EDP Sciences] [Google Scholar]
- Verley, S., Leon, S., Verdes-Montenegro, L., et al. 2007b, A&A, 472, 121 [NASA ADS] [CrossRef] [EDP Sciences] [Google Scholar]
- Véron-Cetty, M.-P., & Véron, P. 2010, A&A, 518, A10 [NASA ADS] [CrossRef] [EDP Sciences] [Google Scholar]
- Villa-Vargas, J., Shlosman, I., & Heller, C. 2010, ApJ, 719, 1470 [NASA ADS] [CrossRef] [Google Scholar]
- Wada, K. 2004, Coevolution of Black Holes and Galaxies (Cambridge: Cambridge Univ. Press), 186 [Google Scholar]
- Wada, K., & Habe, A. 1992, MNRAS, 258, 82 [NASA ADS] [CrossRef] [Google Scholar]
- Walcher, C. J., Wisotzki, L., Bekeraité, S., et al. 2014, A&A, 569, A1 [NASA ADS] [CrossRef] [EDP Sciences] [Google Scholar]
- Wang, J., Kauffmann, G., Overzier, R., et al. 2012, MNRAS, 423, 3486 [NASA ADS] [CrossRef] [Google Scholar]
- Wang, J., Athanassoula, E., Yu, S.-Y., et al. 2020, ApJ, 893, 19 [CrossRef] [Google Scholar]
- Weilbacher, P. M., Streicher, O., Urrutia, T., et al. 2012, in Society of Photo-Optical Instrumentation Engineers (SPIE) Conference Series, 8451 (Proc: SPIE), 84510B [Google Scholar]
- Weilbacher, P. M., Streicher, O., Urrutia, T., et al. 2014, in Astronomical Data Analysis Software and Systems XXIII, eds. N. Manset, P. Forshay, et al., ASP Conf. Ser., 485, 451 [Google Scholar]
- Whyte, L. F., Abraham, R. G., Merrifield, M. R., et al. 2002, MNRAS, 336, 1281 [NASA ADS] [CrossRef] [Google Scholar]
- Willett, K. W., Lintott, C. J., Bamford, S. P., et al. 2013, MNRAS, 435, 2835 [NASA ADS] [CrossRef] [Google Scholar]
- Yi, S. K., Yoon, S. J., Kaviraj, S., et al. 2005, ApJ, 619, L111 [NASA ADS] [CrossRef] [Google Scholar]
- Yi, S. K., Lee, J., Sheen, Y.-K., et al. 2011, ApJS, 195, 22 [NASA ADS] [CrossRef] [Google Scholar]
- Young, J. S., Allen, L., Kenney, J. D. P., Lesser, A., & Rownd, B. 1996, AJ, 112, 1903 [NASA ADS] [CrossRef] [Google Scholar]
- Zurita, A., & Pérez, I. 2008, A&A, 485, 5 [NASA ADS] [CrossRef] [EDP Sciences] [Google Scholar]
- Zurita, A., Rozas, M., & Beckman, J. E. 2001, Ap&SS, 276, 491 [NASA ADS] [CrossRef] [Google Scholar]
- Zurita, A., Relaño, M., Beckman, J. E., & Knapen, J. H. 2004, A&A, 413, 73 [NASA ADS] [CrossRef] [EDP Sciences] [Google Scholar]
- Zurita, A., Florido, E., Bresolin, F., Pérez, I., & Pérez-Montero, E. 2020a, MNRAS, in press, [arXiv:2007.12292] [Google Scholar]
- Zurita, A., Florido, E., Bresolin, F., Pérez-Montero, E., & Pérez, I. 2020b, MNRAS, submitted, [arXiv:2007.12289] [Google Scholar]
Appendix A: Tabulated SF classifications and sources of Hα imaging
Galaxy parameters used in this work, classifications of the distribution of SF in bars, SF activity in inner rings, and sources of Hα imaging.
The following data are listed in Table A.1 (a complete version can be found at the CDS) for all the galaxies in our sample:
-
Column 1: Galaxy identification.
-
Column 2: Total stellar mass (M*) from Muñoz-Mateos et al. (2015).
-
Column 3: Atomic H I gas content (MHI) from HyperLEDA (see Eq. (2)).
-
Column 4: Revised Hubble stage (T) from Buta et al. (2015).
-
Column 5: Bar torque parameter (Qb) from Díaz-García et al. (2016a).
-
Column 6: Bar SF class (A, B, C, N, U) – and subclasses a/b – as described in Table 1, based on GALEX FUV imaging.
-
Column 7: Determination of active (rA) and passive (rP) inner rings (including uncertain cases rU), as described in Sect. 3.2, using GALEX FUV imaging.
-
Column 8: As in Col. 6 (bar SF class), but determined from continuum-subtracted Hα images.
-
Column 9: As in Col. 7 (inner rings SF activity), but determined from continuum-subtracted Hα images.
-
Column 10: Flagging of GALEX UV images from All-Sky Imaging Survey (AIS) (Yes/No).
-
Column 11: Literature sources of Hα images. These are taken from (1) Ryder & Dopita (1993), (2) García-Barreto et al. (1996), (3) Young et al. (1996), (4) Larsen & Richtler (1999), (5) Hameed & Devereux (1999), (6) van Zee (2000), (7) Koopmann et al. (2001), (8) Hoopes et al. (2001), (9) Gavazzi et al. (2003), (10) Gil de Paz et al. (2003), (11) Kennicutt et al. (2003), (12) James et al. (2004), (13) Knapen et al. (2004), (14) Hunter & Elmegreen (2004), (15) Koopmann & Kenney (2006), (16) Meurer et al. (2006), (17) Kaisin & Karachentsev (2006), (18) Epinat et al. (2008), (19) Romano et al. (2008), (20) Dale et al. (2009), (21) Sánchez et al. (2012), (22) Gavazzi et al. (2014), (23) Torres-Flores et al. (2014), (24) Walcher et al. (2014), (25) Boselli et al. (2015), (26) Karachentsev et al. (2015), (27) Sánchez et al. (2016), (28) Galbany et al. (2018), (29) Gavazzi et al. (2018), (30) Cenarro et al. (2019), (31) Erroz-Ferrer et al. (2019), (32) Mendes de Oliveira et al. (2019), (33) NASA/IPAC Extragalactic Database (NED) linking images from Palomar/Las Campanas Atlas of Nearby Galaxies10, (see Gil de Paz et al. 2003), (34) ESO archive, based on observations made at the European Southern Observatory using the Very Large Telescope under programs:
-
(34.1) 60.A-9313(A) , Gadotti et al. (2015).
-
(34.2) 096.D-0263(A) , Lyman et al. (2018).
-
(34.3) 095.D-0172(A) , Kuncarayakti et al. (2018).
-
(34.4) 296.B-5054(A) , Iodice et al. (2019).
-
(34.5) 60.A-9319(A) 11.
-
(34.6) 097.B-0640(A) , Gadotti et al. (2019).
-
(34.7) 098.A-0364(A) 11.
-
(34.8) 1100.B-0651(A) , Kreckel et al. (2019).
-
(34.9) 1100.B-0651(B) , Kreckel et al. (2019).
-
(34.10) 1100.B-0651(C) , Kreckel et al. (2019).
-
(34.11) 094.B-0321(A) , Mingozzi et al. (2019).
-
(34.12) 0100.A-0607(A) , Boselli et al. (2019).
-
(34.13) 0101.A-0282(A) , Boselli et al. (2019).
-
(34.14) 60.A-9100(A) 12.
-
(34.15) 0101.D-0748(A) , López-Cobá et al. (2020).
-
(34.16) 097.D-0408(A) , López-Cobá et al. (2020).
-
(34.17) 0104.B-0668(A) 11.
-
(34.18) 0103.D-0440(A) , Lyman et al. (2020).
-
(34.19) 096.B-0449(A) 11.
-
(34.20) 0103.B-0582(A) 11.
-
Appendix B: Statistical trends are unaffected by the presence of AGN or the depth of the UV imaging
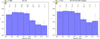 |
Fig. B.1. Fraction of galaxies classified as C (SF along bar), as seen in FUV images, as a function of the decimal logarithm of the total stellar mass. Left panel: sample that includes images from the GALEX All-Sky Imaging Survey (AIS, with fairly short exposure times); right panel: only galaxies from the FUV sample with exposure times of 1000 s or more (i.e., excluding AIS). The numbers in each of the mass bins are shown above the bars for each M*-bin (of width 0.5 dex). |
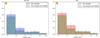 |
Fig. B.2. Fraction of galaxies of SF class A (star formation only in the central regions) as a function of the revised Hubble stage for the FUV sample (left panel) and for the Hα sample (right panel), including and excluding those galaxies that have an AGN according to Véron-Cetty & Véron (2010). |
Here we test possible dependences of the classifications performed in Sect 3.2 on the depth of the FUV imaging. We also check whether the presence of AGN, which are known to be responsible for photoionization in the central regions of galaxies, can be responsible for the nuclear FUV and Hα emission (class A) and thus affect our statistics.
A number of galaxies in the FUV sample belong to the GALEX All-Sky Imaging Survey (AIS); they had low exposure times (on the order of 100 s), and thus the detection of SF along the bar (category C) can be compromised by the depth of the images. In Fig. B.1 we show the frequency of galaxies of class C versus the total stellar mass of the host galaxy, including and excluding the AIS images (the latter decreases the sample size by almost 50%). We confirm that the statistical trends presented in Fig. 12 are not affected by the depth of the FUV images: as shown in Sect. 3.4, the less massive the galaxy is, the more common class C is.
The second possible shortcoming is that the Hα and FUV emission detected in the center of some galaxies may be due to AGN photoionization of surrounding gas, and not to SF. This is relevant for the assignment of class A in our classification system. In Fig. B.2 we show the fraction of class A galaxies with and without AGN (according to Véron-Cetty & Véron 2010) as a function of the Hubble type, obtaining similar statistical trends (differences are smaller than the binomial counting error bars per T-bin). In conclusion, we verified that AGN are not a major source of uncertainty in our statistical analysis.
Appendix C: Fraction of active inner rings
In this section we study the fraction of inner rings that have undergone recent SF, based on the classifications from Sect. 3.2, using both GALEX FUV and continuum-subtracted Hα imaging. We only probe those inner (pseudo)rings classified by Buta et al. (2015) in the S4G. We confirm that passive rings are mostly hosted by early-type galaxies (Fig. C.1), mainly lenticular galaxies in which the fraction of active rings is ≲50%. Naturally, this is a consequence of passive rings being harboured by galaxies with low relative amounts of H I gas (Fig. C.2).
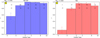 |
Fig. C.1. Fraction of inner rings that host SF as a function of the morphological type of the galaxy, identified based on the flux in GALEX FUV (left) and continuum-subtracted Hα (right) imaging. |
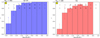 |
Fig. C.2. As in Fig. C.1, but as a function of the H I gas content normalized by the total stellar mass. |
Appendix D: Average bars as a function of the total stellar mass
We characterize the spatial distribution of SF in bars by stacking GALEX NUV and FUV images (see Sect. 2.1) after binning the parent sample as a function of the total stellar mass (Figs. D.1 and D.2).
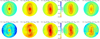 |
Fig. D.1. As in Fig. 1, but binning the sample as a function of the total stellar mass of the host galaxy. |
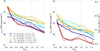 |
Fig. D.2. As in Fig. 2, but binning galaxies with respect to the total stellar mass. Azimuthally averaged mean FUV and NUV density profiles are derived from the bar stacks in Fig. D.1. |
Appendix E: Comparative analysis of mean NUV luminosity profiles for non-barred and weakly or strongly barred galaxies (complementary figures)
By averaging GALEX NUV images, we confirm the differences in SF between weakly or strongly barred and non-barred galaxies (Fig. E.1 and left panel of Fig. E.2) that were reported using FUV in Sects. 2.1.2 and 2.2, for different T- and M*-bins. We also study average radial distribution of SF in inner-ringed galaxies using NUV (right panel of Fig. E.2), and confirm that the shapes of the profiles for barred and non-barred galaxies hosting inner rings are very similar (as reported in Sect. 2.2 using FUV).
All Tables
Galaxy parameters used in this work, classifications of the distribution of SF in bars, SF activity in inner rings, and sources of Hα imaging.
All Figures
|
Fig. 1. Two-dimensional synthetic stellar bars constructed from co-added NUV (top) and FUV (bottom) images of disk galaxies that were oriented and scaled with respect to the bars, flipped to make the spiral arms wind clockwise (if needed), and grouped based on revised Hubble stage (T, increasing from left to right). The number of galaxies in each subsample is also indicated. Bar stacks are shown in units of mag arcsec−2 (see vertical bar for thresholds and color-coding) and cropped to a radius 1.5 ⋅ rbar, so that all binned galaxies are covered radially. The dotted lines show isophotal contours with a step of 0.35 mag arcsec−2. The ellipse represents the average ellipticity (3.6 μm) of the galaxies in the bin (from Herrera-Endoqui et al. 2015; Díaz-García et al. 2016a). The mean bar length is used as a unit, but the actual mean 3.6 μm bar lengths in kpc vary for each T-bin (see Fig. 11 and Table 3 in Díaz-García et al. 2016a) and are lowest among the faintest galaxies. |
| In the text | |
|
Fig. 2. Azimuthally averaged mean NUV (left) and FUV (right) luminosity profiles (solid lines), in bins of numerical Hubble type, obtained from the 2D bar stacks shown in Fig. 1. The dashed lines correspond to the surface brightness cut along the bar major axis. The vertical dotted line indicates the bar end. FUV luminosities are converted to ΣSFR (right y-axis of the right panel) using Eq. (1). |
| In the text | |
|
Fig. 3. Azimuthally averaged mean FUV luminosity profiles obtained from the bar stacks of weakly and strongly barred galaxies (based on the family classification from Buta et al. 2015) with total stellar masses 108.5 M⊙ < M* < 1011 M⊙, considering separately early-type (T < 5, upper panel) and late-type galaxies (T ≥ 5, lower panel). The same plots using NUV are shown in Fig. E.1. |
| In the text | |
|
Fig. 4. Mean μNUV (left) and μFUV (right) 1D profiles as a function of galactocentric radius for different subsamples defined as a function of the total stellar mass (in bins of 0.5 dex; see legend) (see also Bouquin et al. 2018). Error bars correspond to the standard deviation of the mean ( |
| In the text | |
|
Fig. 5. As in Fig. 4, but for the dispersion of the μNUV (left) and μFUV (right) luminosity profiles. |
| In the text | |
|
Fig. 6. Mean μFUV 1D radial profiles in bins of total stellar mass (1 dex in width), separating barred (solid line) and non-barred galaxies (dashed line) (95% radial coverage). The vertical dotted lines indicate the mean bar size of the barred galaxies in each of the M*-bins. The same plot for μNUV can be found in Fig. E.2. |
| In the text | |
|
Fig. 7. Mean FUV 1D average luminosity profiles for barred (black) and non-barred (red) galaxies hosting an inner ring, with total stellar masses 109.5 < M*/M⊙ < 1011. Vertical bars correspond to the standard deviation of the mean. The luminosity profiles were scaled with respect to the deprojected semi-major axis of the inner ring, labeled SMA(inner ring), before they were co-added. |
| In the text | |
|
Fig. 8. Illustrative example of SF class A (only circumnuclear star formation): NGC 0936. Shown are the Spitzer 3.6 μm (S4G) (left), GALEX FUV (center), and continuum-subtracted Hα images (right; from Mendes de Oliveira et al. 2019, but subtraction performed by us). |
| In the text | |
|
Fig. 9. As in Fig. 8, but for SF class B (star formation at the bar ends, but not along the bar) and subclass “a” (circumnuclear SF): NGC 1300 (top) and NGC 5850 (bottom). Hα images are from Knapen et al. (2004). |
| In the text | |
|
Fig. 10. As in Fig. 8, but for SF class C (galaxies with SF along the bar) and subclass “a” (circumnuclear SF): NGC 1097 (top), NGC 1365 (middle), and NGC 3023 (bottom). Hα images are respectively from Kennicutt et al. (2003) and from the ESO archive (see Table A.1) (mosaics and continuum-subtraction performed by us from the MUSE archive, covering a smaller field of view than the FUV and 3.6 μm images). |
| In the text | |
|
Fig. 11. Fraction of SF classes as a function of the revised Hubble stage, classified based on the FUV (upper panels, in blue) and continuum-subtracted Hα emission (lower panels, in red). The subpanels correspond to SF classes A (only circumnuclear SF, top), B (SF at the bar ends, but not along bar, middle), and C (SF along bar, bottom). Error bars correspond to binomial errors. Indicated for each category is the number of analyzed galaxies within the bin (bottom row of numbers), and the number of identified cases in each SF class (top row of numbers). In the upper left corners the total number of analyzed galaxies (Ngal) are given. |
| In the text | |
|
Fig. 12. As in Fig. 11, but as a function of total stellar mass of the host galaxy, in bins of 0.5 dex and in units of solar masses. |
| In the text | |
|
Fig. 13. As in Fig. 11, but as a function of the H I gas fraction (relative to the total stellar mass), in bins of 0.5 dex. |
| In the text | |
|
Fig. 14. As in Fig. 11, but as a function of the bar strength, measured from the maximum of the tangential-to-radial force ratio at the bar region, using bins of 0.1. |
| In the text | |
|
Fig. B.1. Fraction of galaxies classified as C (SF along bar), as seen in FUV images, as a function of the decimal logarithm of the total stellar mass. Left panel: sample that includes images from the GALEX All-Sky Imaging Survey (AIS, with fairly short exposure times); right panel: only galaxies from the FUV sample with exposure times of 1000 s or more (i.e., excluding AIS). The numbers in each of the mass bins are shown above the bars for each M*-bin (of width 0.5 dex). |
| In the text | |
|
Fig. B.2. Fraction of galaxies of SF class A (star formation only in the central regions) as a function of the revised Hubble stage for the FUV sample (left panel) and for the Hα sample (right panel), including and excluding those galaxies that have an AGN according to Véron-Cetty & Véron (2010). |
| In the text | |
|
Fig. C.1. Fraction of inner rings that host SF as a function of the morphological type of the galaxy, identified based on the flux in GALEX FUV (left) and continuum-subtracted Hα (right) imaging. |
| In the text | |
|
Fig. C.2. As in Fig. C.1, but as a function of the H I gas content normalized by the total stellar mass. |
| In the text | |
|
Fig. D.1. As in Fig. 1, but binning the sample as a function of the total stellar mass of the host galaxy. |
| In the text | |
|
Fig. D.2. As in Fig. 2, but binning galaxies with respect to the total stellar mass. Azimuthally averaged mean FUV and NUV density profiles are derived from the bar stacks in Fig. D.1. |
| In the text | |
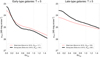 |
Fig. E.1. As in Fig. 3, but using NUV imaging. |
| In the text | |
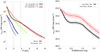 |
Fig. E.2. As in Fig. 6 (left) and Fig. 7 (right), but using NUV imaging. |
| In the text | |
Current usage metrics show cumulative count of Article Views (full-text article views including HTML views, PDF and ePub downloads, according to the available data) and Abstracts Views on Vision4Press platform.
Data correspond to usage on the plateform after 2015. The current usage metrics is available 48-96 hours after online publication and is updated daily on week days.
Initial download of the metrics may take a while.