Fig. 2.
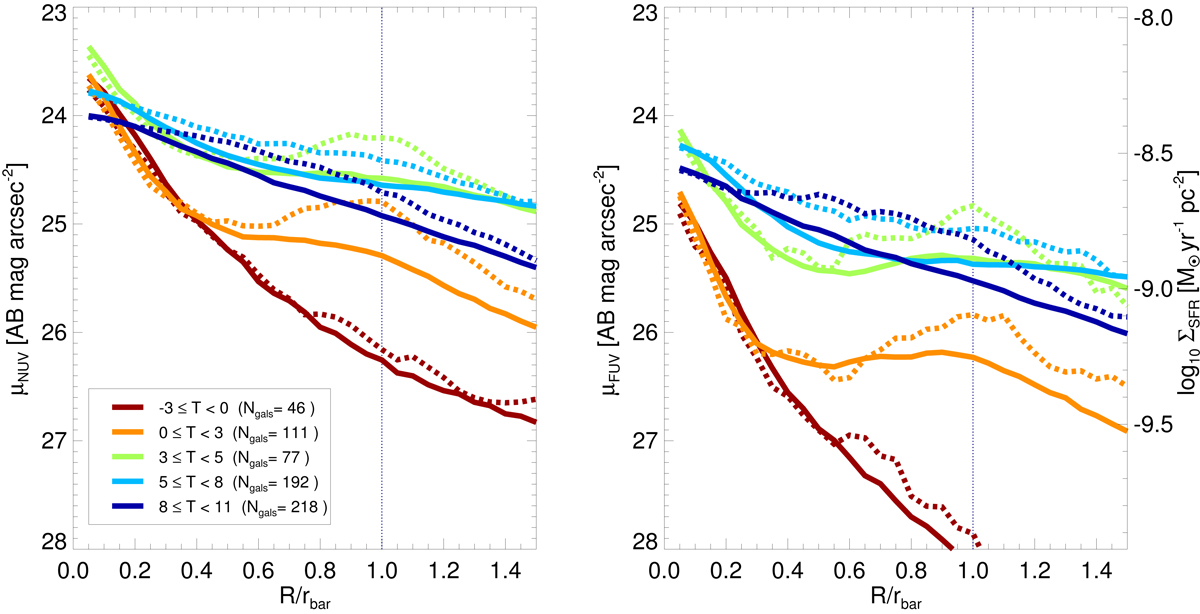
Azimuthally averaged mean NUV (left) and FUV (right) luminosity profiles (solid lines), in bins of numerical Hubble type, obtained from the 2D bar stacks shown in Fig. 1. The dashed lines correspond to the surface brightness cut along the bar major axis. The vertical dotted line indicates the bar end. FUV luminosities are converted to ΣSFR (right y-axis of the right panel) using Eq. (1).
Current usage metrics show cumulative count of Article Views (full-text article views including HTML views, PDF and ePub downloads, according to the available data) and Abstracts Views on Vision4Press platform.
Data correspond to usage on the plateform after 2015. The current usage metrics is available 48-96 hours after online publication and is updated daily on week days.
Initial download of the metrics may take a while.