Fig. 4.
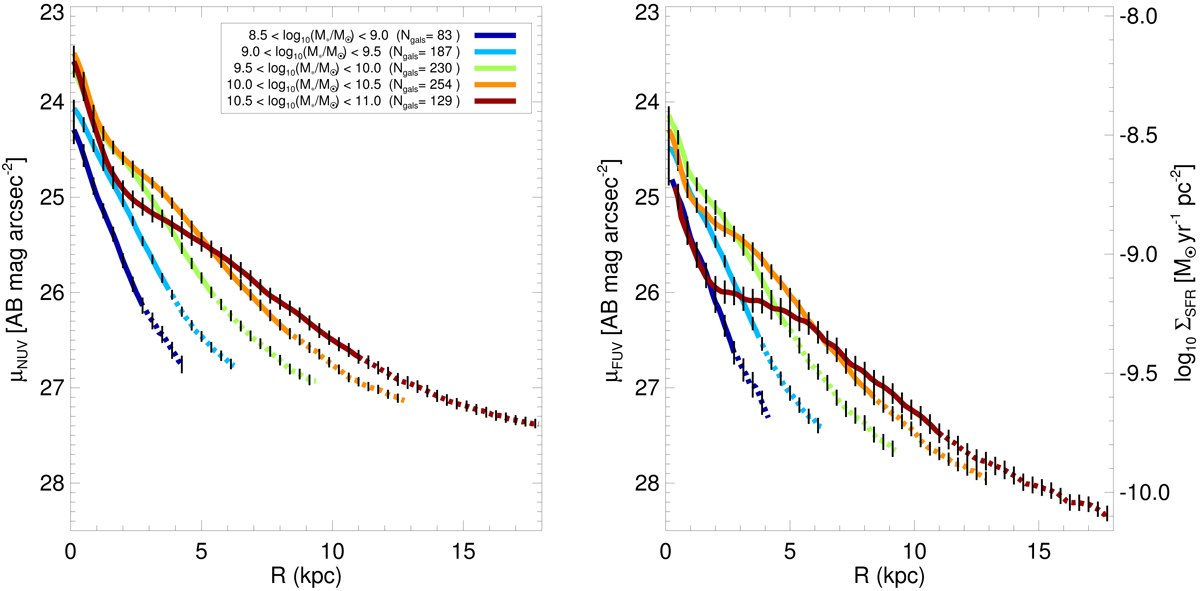
Mean μNUV (left) and μFUV (right) 1D profiles as a function of galactocentric radius for different subsamples defined as a function of the total stellar mass (in bins of 0.5 dex; see legend) (see also Bouquin et al. 2018). Error bars correspond to the standard deviation of the mean (![]() ). The dashed lines show the average luminosity profiles where the radial sample coverage is greater than 75% and lower than 100%, and thus where uncertainties are larger (e.g., artificially created up-bending sections due to dominance of more extended UV disks with fainter extrapolated central surface brightnesses).
). The dashed lines show the average luminosity profiles where the radial sample coverage is greater than 75% and lower than 100%, and thus where uncertainties are larger (e.g., artificially created up-bending sections due to dominance of more extended UV disks with fainter extrapolated central surface brightnesses).
Current usage metrics show cumulative count of Article Views (full-text article views including HTML views, PDF and ePub downloads, according to the available data) and Abstracts Views on Vision4Press platform.
Data correspond to usage on the plateform after 2015. The current usage metrics is available 48-96 hours after online publication and is updated daily on week days.
Initial download of the metrics may take a while.