Free Access
Fig. 6
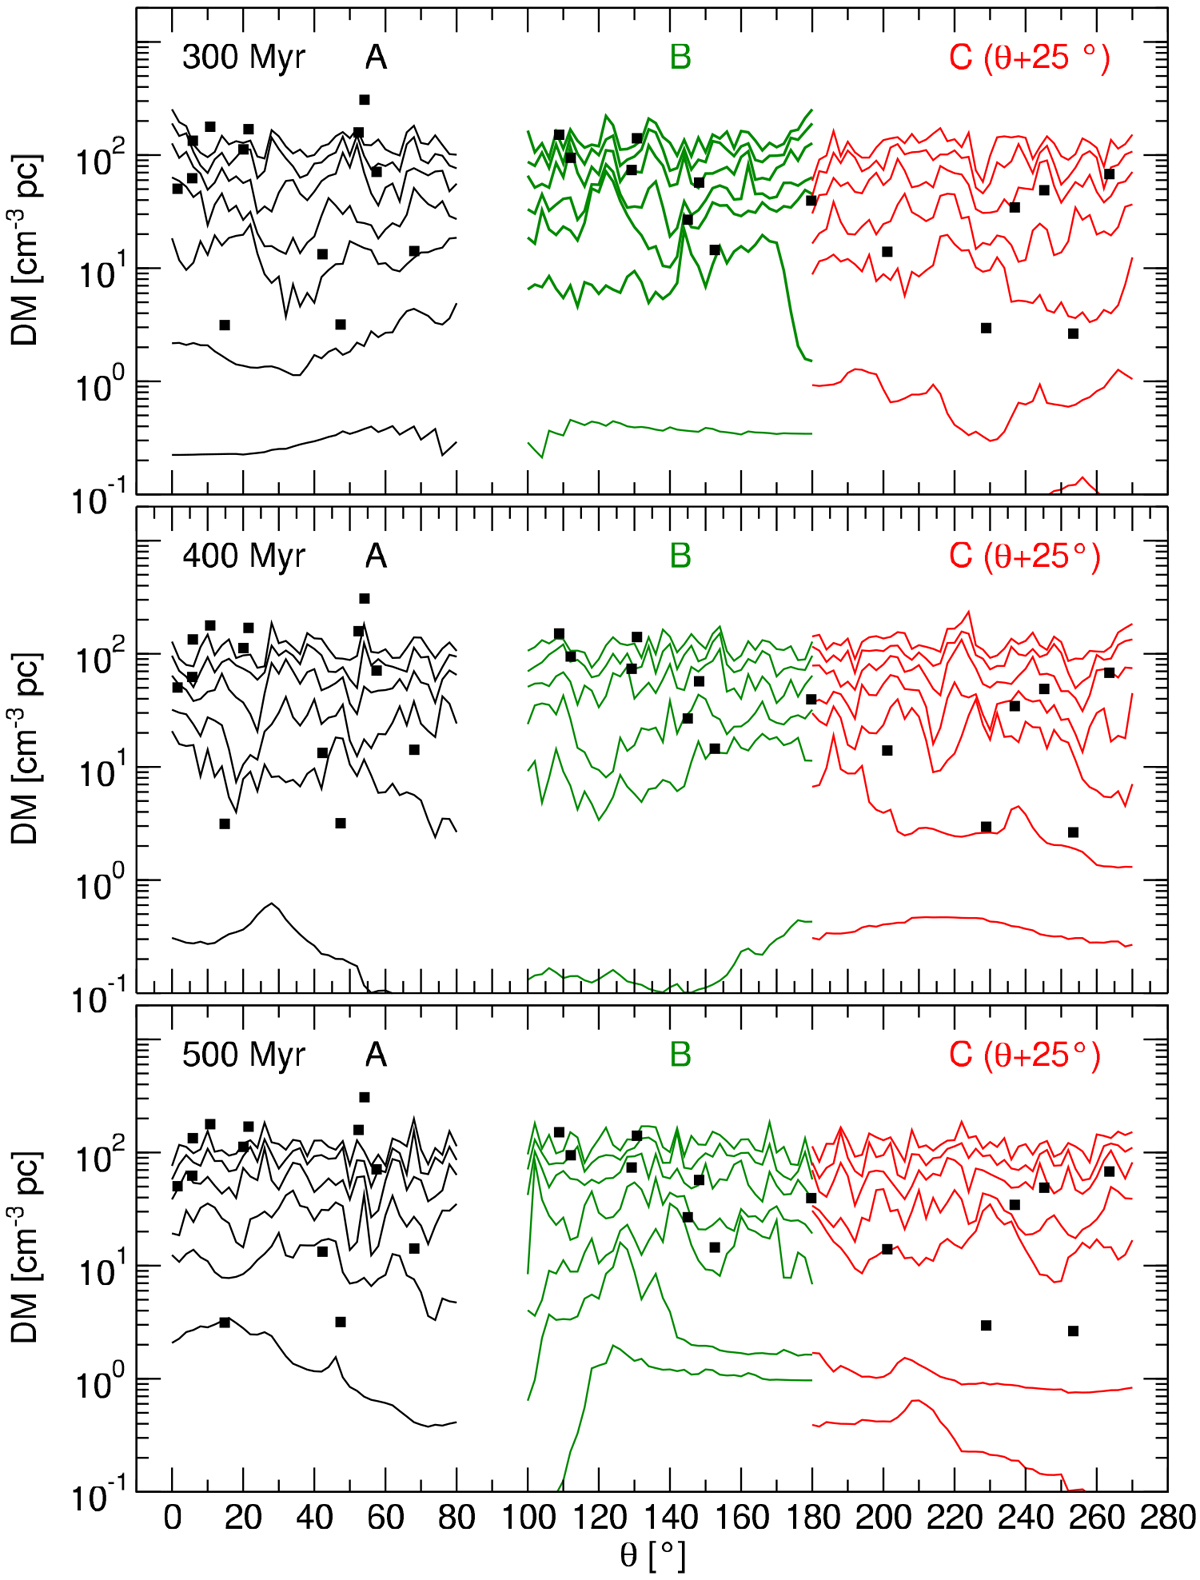
Angular distribution of the dispersion measures observed from positions A, B, and C at (from top to bottom) 4000, 3000, 2000, 1000, 500, 100, and 10 pc. The data from position C is deviated by 25° with regard to their original angles (135°−225°) in order to avoid overlapping with the observations between positions B and C.
Current usage metrics show cumulative count of Article Views (full-text article views including HTML views, PDF and ePub downloads, according to the available data) and Abstracts Views on Vision4Press platform.
Data correspond to usage on the plateform after 2015. The current usage metrics is available 48-96 hours after online publication and is updated daily on week days.
Initial download of the metrics may take a while.