Fig. 4
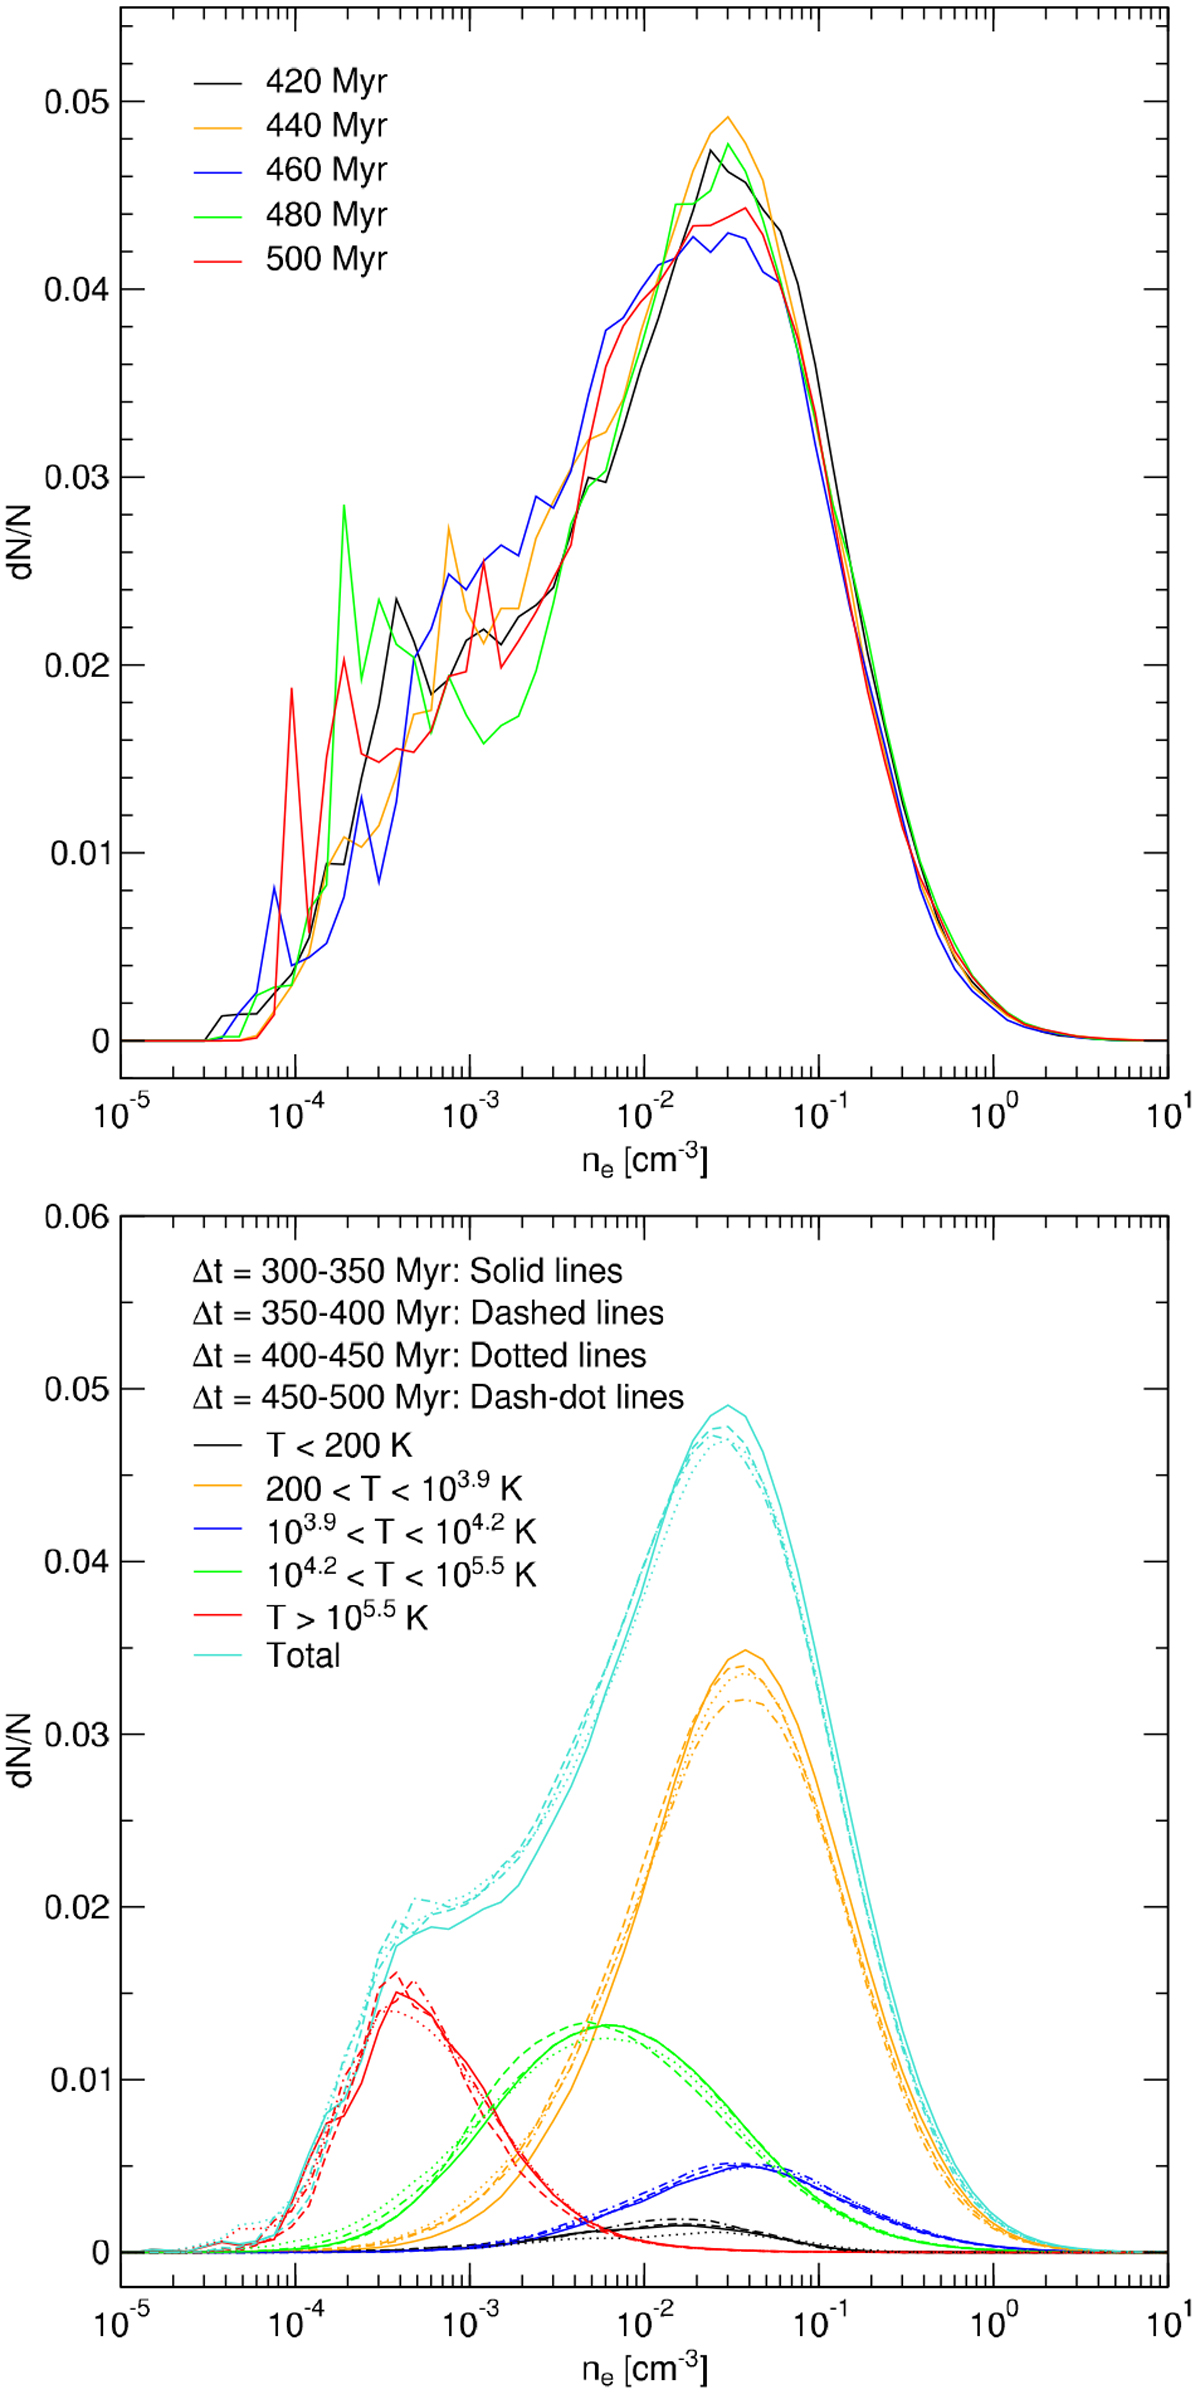
Top panel: histograms of the electron density in the Galactic disk at different times from 400 through 500 Myr at every 20 Myr. Bottom panel: time averaged volume histograms of the electron density in the Galactic disk for different temperature regimes and total density (brown) calculated between 400 and 500 Myr using 51 snapshots with a time interval of 1 Myr.
Current usage metrics show cumulative count of Article Views (full-text article views including HTML views, PDF and ePub downloads, according to the available data) and Abstracts Views on Vision4Press platform.
Data correspond to usage on the plateform after 2015. The current usage metrics is available 48-96 hours after online publication and is updated daily on week days.
Initial download of the metrics may take a while.