Fig. 5
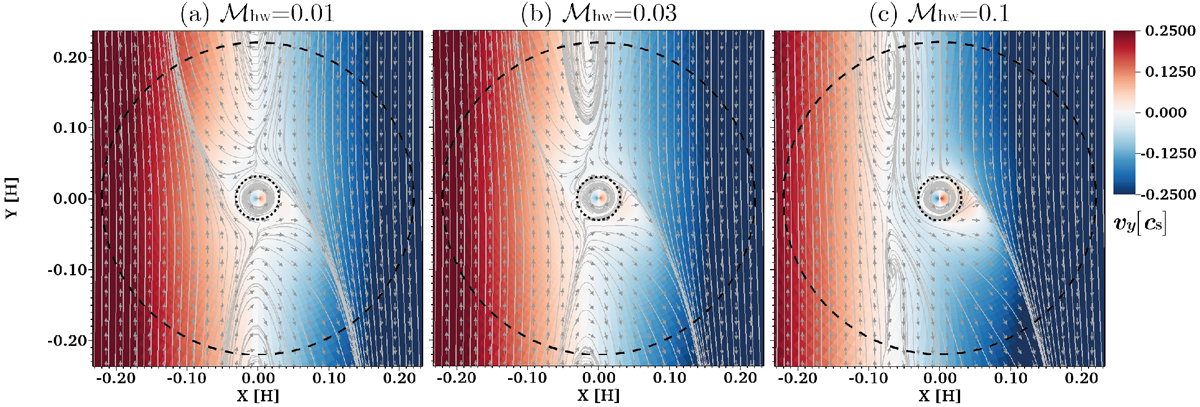
Flow structure around a planet with m = 0.03 at the midplane of the disk. Panel a: result obtained from m003-hw001 at t = 50. Panel b: result obtained from m003-hw003 at t = 50. Panel c: result obtained from m003-hw01 at t = 50. Color contour represents the flow speed in the y-direction. The verticaland horizontal axis are normalized by the scale height of the disk. The solid lines correspond to the specific streamlines.The dotted and dashed lines are the Bondi and Hill radius of the planet, respectively. We note that the length of the arrows does not scale with the flow speed.
Current usage metrics show cumulative count of Article Views (full-text article views including HTML views, PDF and ePub downloads, according to the available data) and Abstracts Views on Vision4Press platform.
Data correspond to usage on the plateform after 2015. The current usage metrics is available 48-96 hours after online publication and is updated daily on week days.
Initial download of the metrics may take a while.