Fig. 20
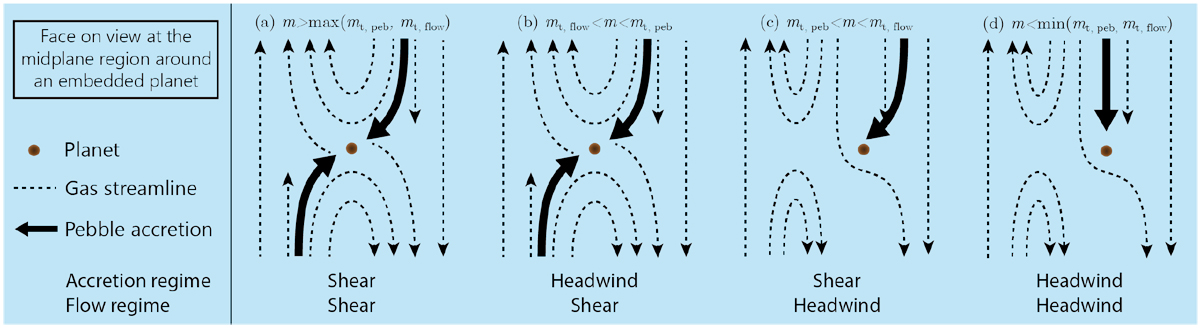
Schematic illustration of the flow structure and the trajectories of accreted pebbles at the midplane region. We classify the results obtained in both Paper I and this study into four categories based on the relation between m, mt, flow, and mt,peb. We note that the gas streamlines and the trajectories of accreted pebbles are rough outlines and may differ slightly from the actual ones.
Current usage metrics show cumulative count of Article Views (full-text article views including HTML views, PDF and ePub downloads, according to the available data) and Abstracts Views on Vision4Press platform.
Data correspond to usage on the plateform after 2015. The current usage metrics is available 48-96 hours after online publication and is updated daily on week days.
Initial download of the metrics may take a while.