Fig. 19
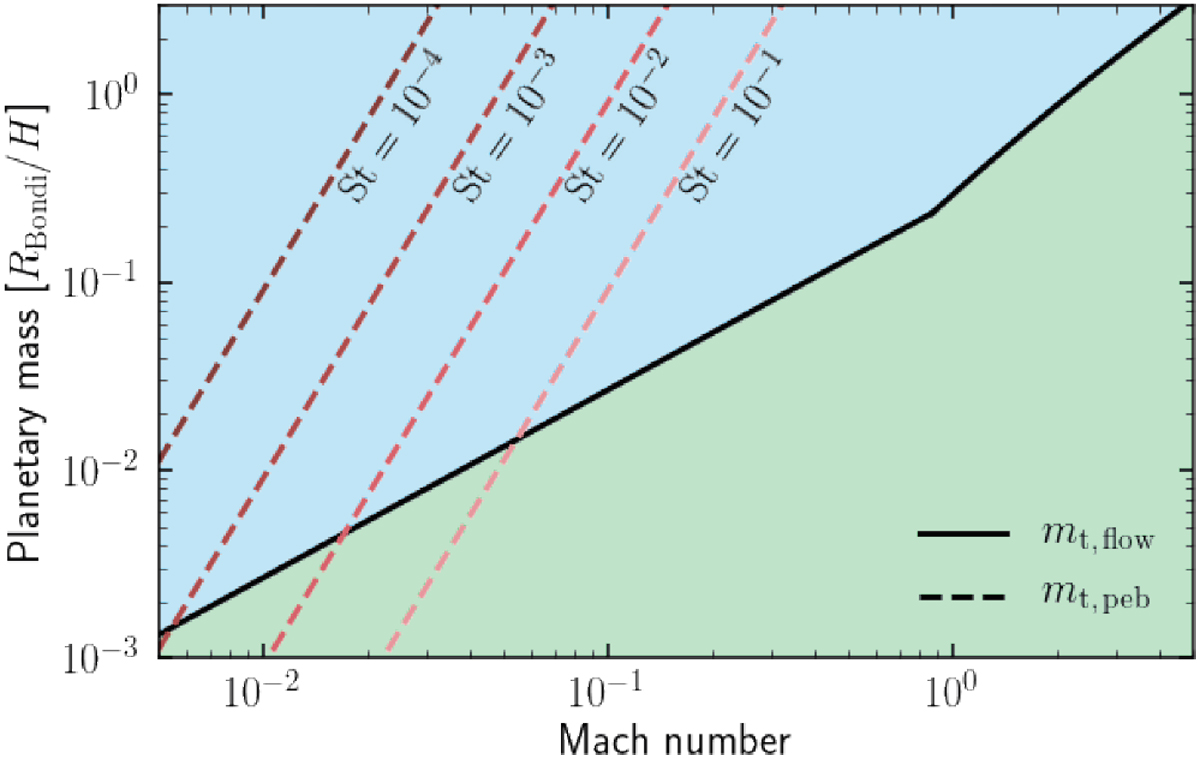
Flow transition mass as a function of the Mach number of the headwind of the gas (black solid line). Dashed lines correspond to the pebble transition mass with different Stokes numbers (Eq. (A.4)). Blue and green regions correspond to the flow-shear and the flow-headwind regime, respectively. Since our study does not deal with gap formation (related to high-mass planets; Sect. 4.3.3), the range of the vertical axis is set to m ≤ 3.
Current usage metrics show cumulative count of Article Views (full-text article views including HTML views, PDF and ePub downloads, according to the available data) and Abstracts Views on Vision4Press platform.
Data correspond to usage on the plateform after 2015. The current usage metrics is available 48-96 hours after online publication and is updated daily on week days.
Initial download of the metrics may take a while.