Fig. 18
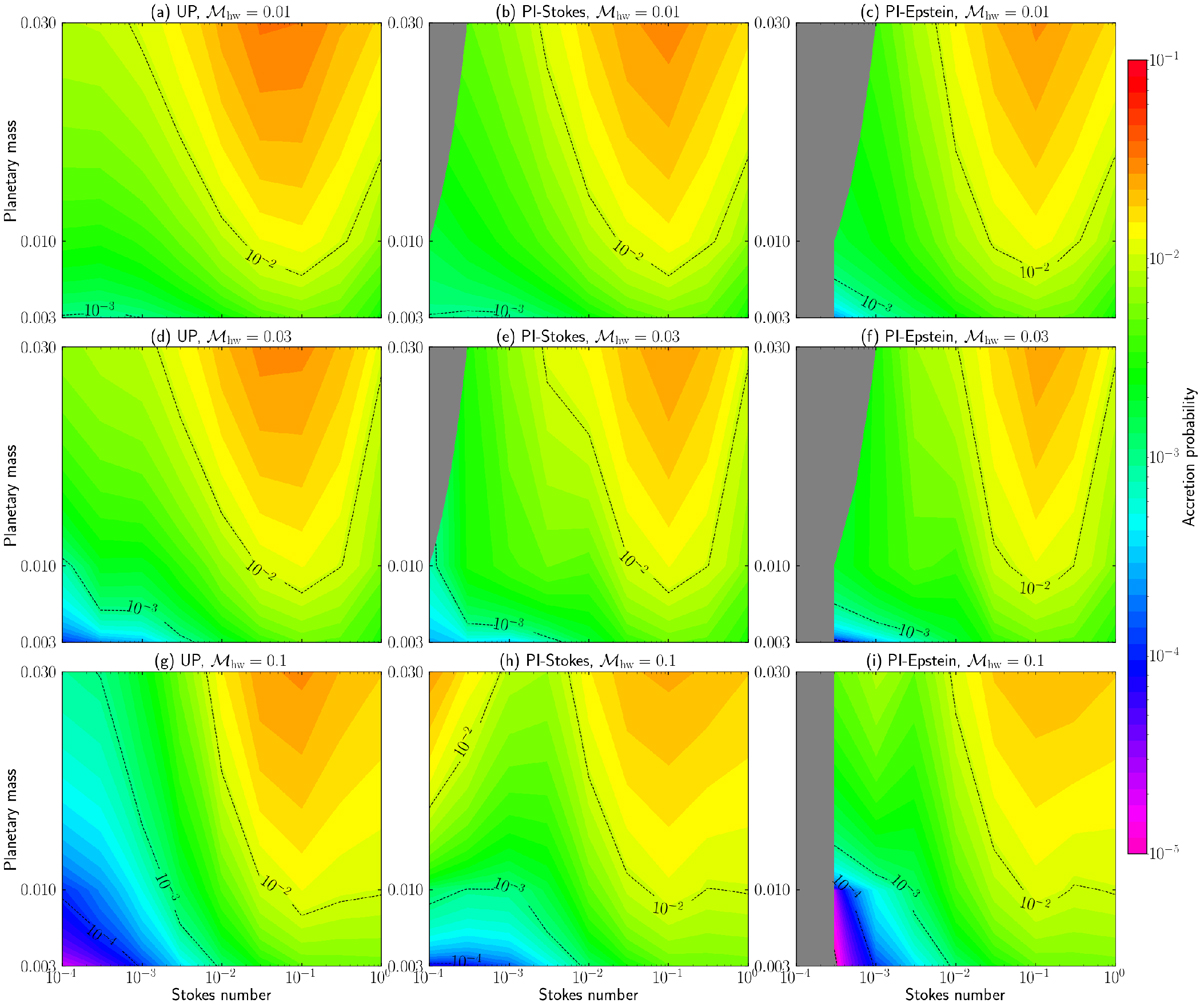
Accretion probability as a function of the planetary mass and the Stokes number for the Mach number
![]() and 0.1 (bottom to top) in the UP case (left column), the PI-Stokes case (middle column), and the PI-Epstein case (right column). The contours represent the accretion probabilities. We assume α = 10−3. The gray-shaded region is the region where Pacc = 0.
and 0.1 (bottom to top) in the UP case (left column), the PI-Stokes case (middle column), and the PI-Epstein case (right column). The contours represent the accretion probabilities. We assume α = 10−3. The gray-shaded region is the region where Pacc = 0.
Current usage metrics show cumulative count of Article Views (full-text article views including HTML views, PDF and ePub downloads, according to the available data) and Abstracts Views on Vision4Press platform.
Data correspond to usage on the plateform after 2015. The current usage metrics is available 48-96 hours after online publication and is updated daily on week days.
Initial download of the metrics may take a while.