Fig. 17
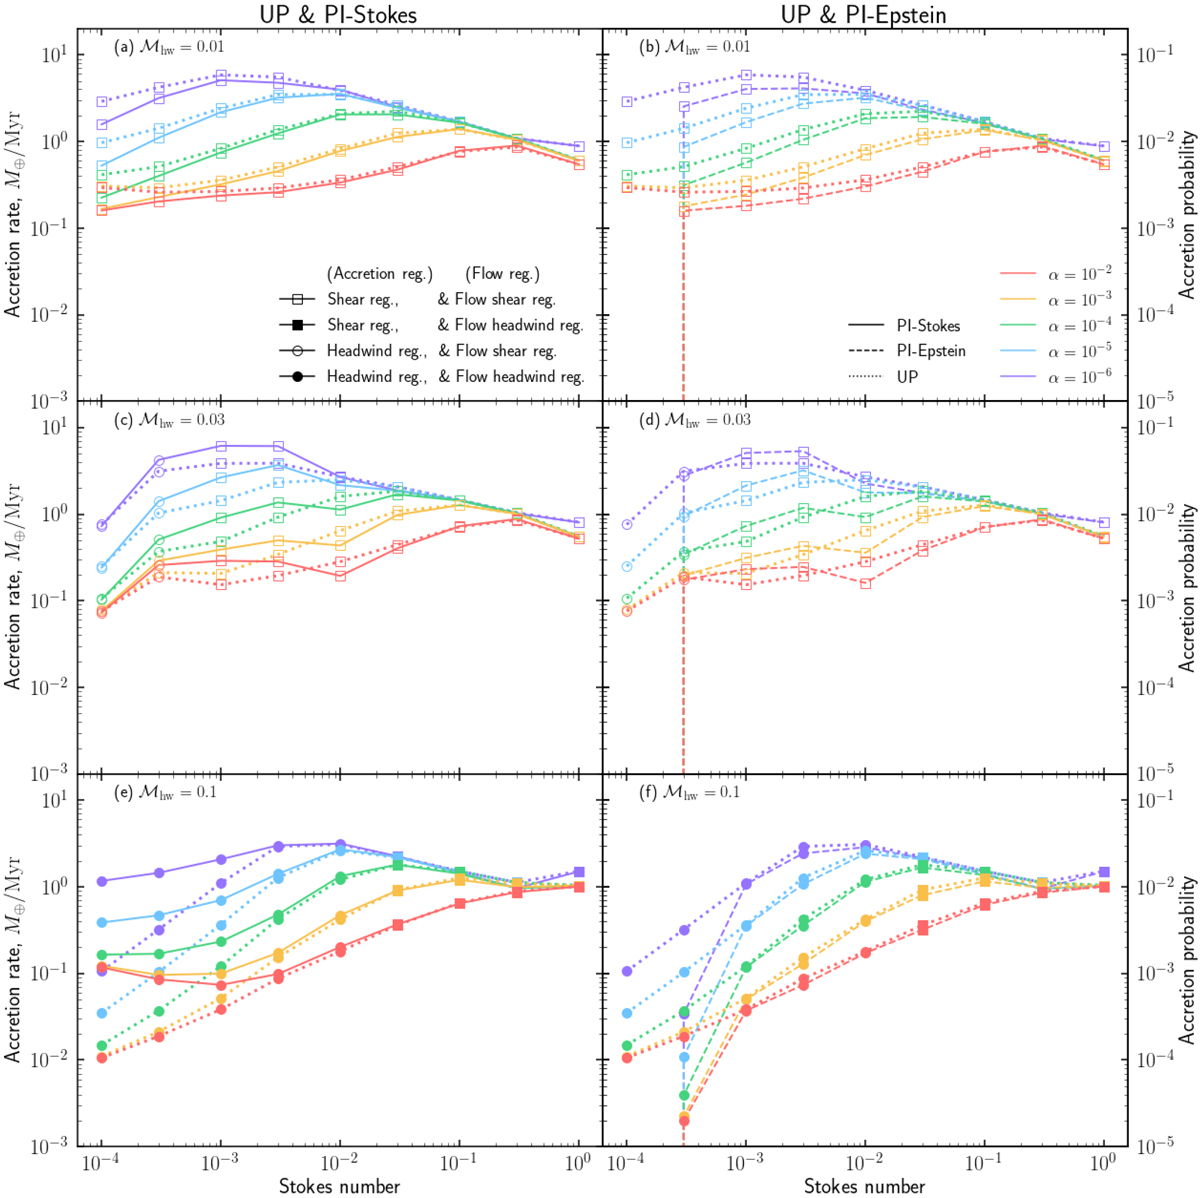
3D accretion rate, Ṁ3D, (left vertical axis) and probability (right vertical axis) as a function of the Stokes number in UP-m001 (dotted lines), PI-Stokes-m001 (solid lines), and PI-Epstein-m001 cases (dashed lines). Left column: compares the results between UP and PI-Stokes cases. Right column: compares the results between UP and PI-Epstein cases. Colors indicate the turbulent parameter, α. The open and filled squares and circles denote the regimes of pebble accretion and the planet-induced gas flow at the given parameters.
Current usage metrics show cumulative count of Article Views (full-text article views including HTML views, PDF and ePub downloads, according to the available data) and Abstracts Views on Vision4Press platform.
Data correspond to usage on the plateform after 2015. The current usage metrics is available 48-96 hours after online publication and is updated daily on week days.
Initial download of the metrics may take a while.