Fig. 5
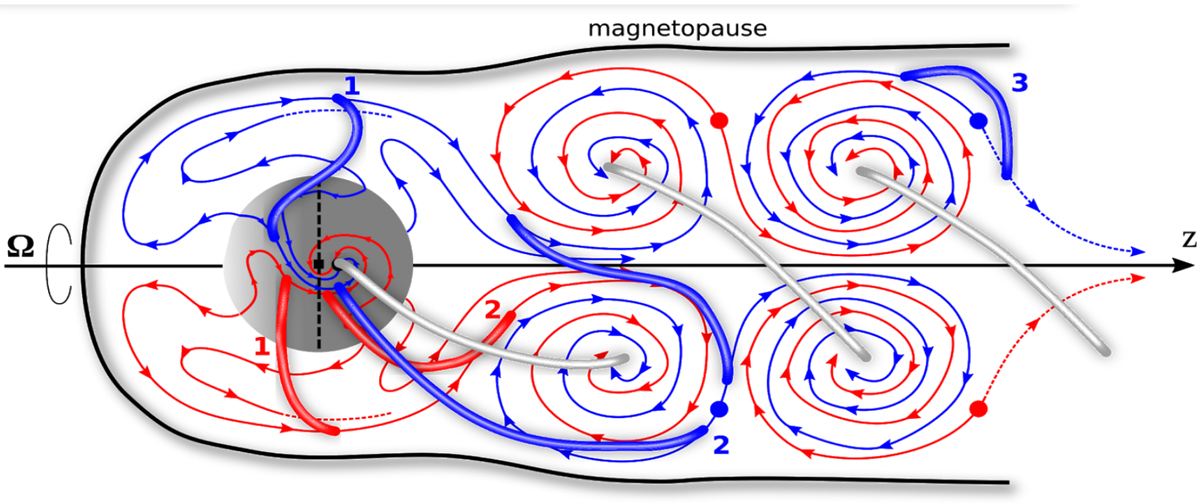
Polar view in the rotating frame. Shown are the trajectory of the foot points of selected field lines in the ionosphere (one hemisphere only), as well as the trajectory of the field lines’ intersection points with the equatorial plane. Blue and red correspond to mutually conjugate lines. The grey tubes represent the asymptotic position of all field lines.
Current usage metrics show cumulative count of Article Views (full-text article views including HTML views, PDF and ePub downloads, according to the available data) and Abstracts Views on Vision4Press platform.
Data correspond to usage on the plateform after 2015. The current usage metrics is available 48-96 hours after online publication and is updated daily on week days.
Initial download of the metrics may take a while.