Fig. 9.
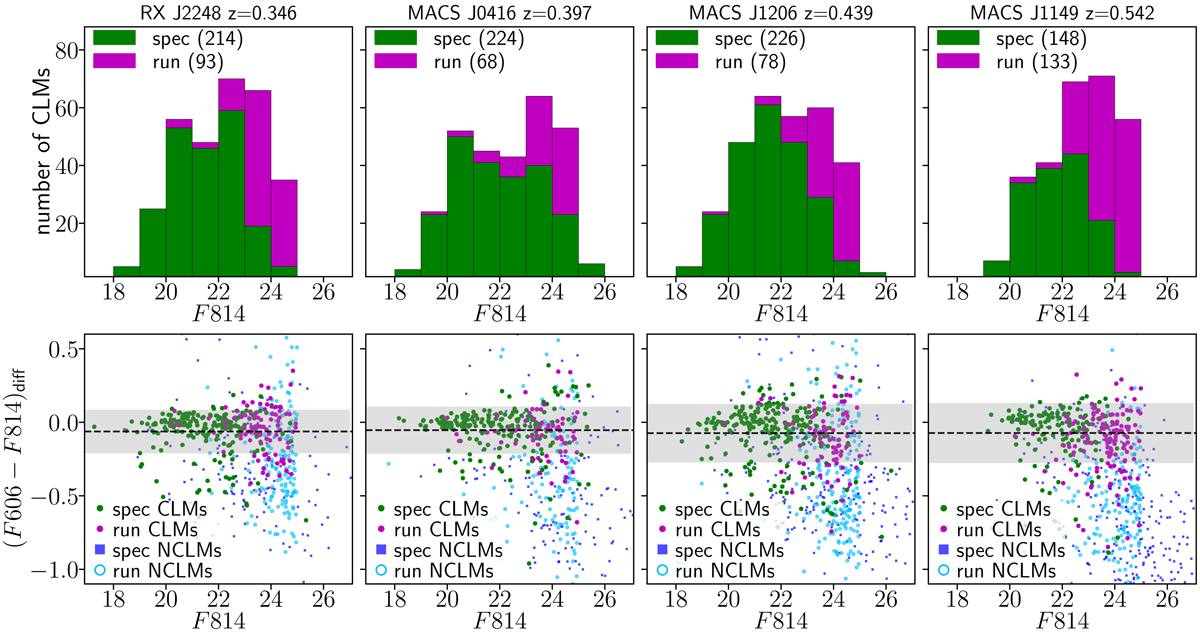
CNN membership prediction (run) together with spectroscopic sources, represented as (i) CLMs distribution of F814 magnitudes (first row), (ii) differential colour – magnitude sequence for both CLMs and NCLMs. Spectroscopic CLMs are shown in green, candidate members in purple, spectroscopic NCLMs with blue squares and candidate NCLMs with open cyan circle. We only plot CNN cluster members with F814 ≤ 25 mag. The grey region within the CM diagrams limits the area corresponding to ±1σ from the median (dashed horizontal line) of (F606 − F814)diff.
Current usage metrics show cumulative count of Article Views (full-text article views including HTML views, PDF and ePub downloads, according to the available data) and Abstracts Views on Vision4Press platform.
Data correspond to usage on the plateform after 2015. The current usage metrics is available 48-96 hours after online publication and is updated daily on week days.
Initial download of the metrics may take a while.