Fig. 7.
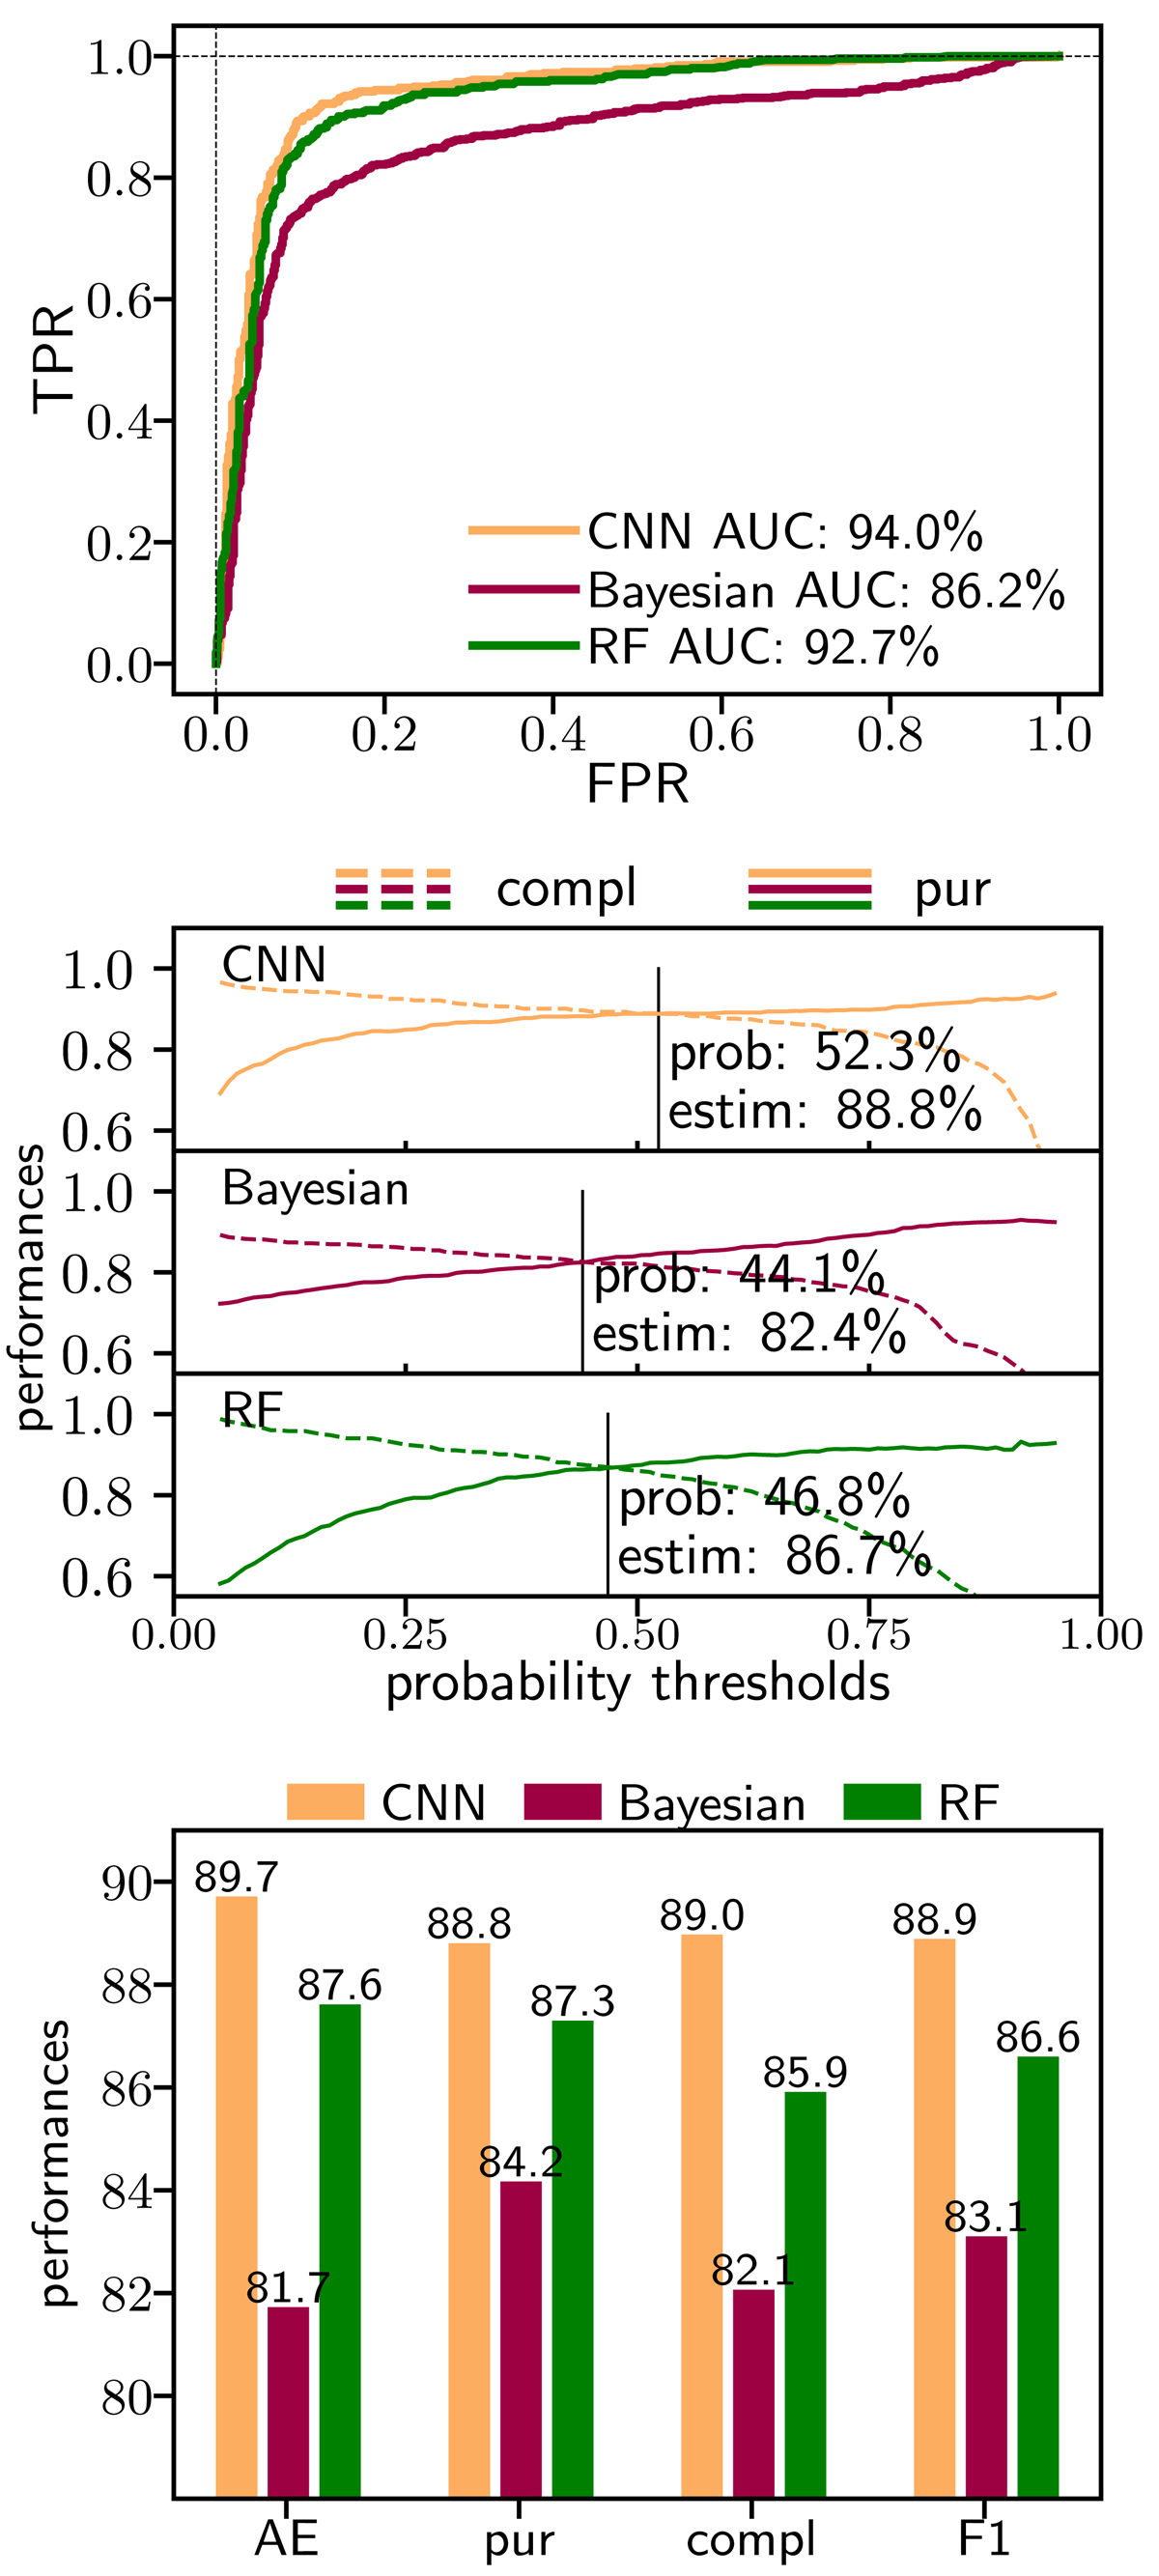
Comparison among the image-based CNN and two photometric catalogue-based approaches, namely, a random forest and Bayesian method (EXP3), by combining results from the four clusters (R2248, M0416, M1206, M1149). Upper panel shows the ROC curves for the three methods with measured Area Under the Curve (AUC). The middle panel reports the trends of purity and completeness as a function of the probability thresholds used to obtain the ROC curves. In the three diagrams, we mark the intersection between such curves, i.e. the probability for which completeness and purity are equal. Bottom panel shows the differences between the three methods based on the statistical estimators described in Appendix A.3.
Current usage metrics show cumulative count of Article Views (full-text article views including HTML views, PDF and ePub downloads, according to the available data) and Abstracts Views on Vision4Press platform.
Data correspond to usage on the plateform after 2015. The current usage metrics is available 48-96 hours after online publication and is updated daily on week days.
Initial download of the metrics may take a while.