Fig. 6.
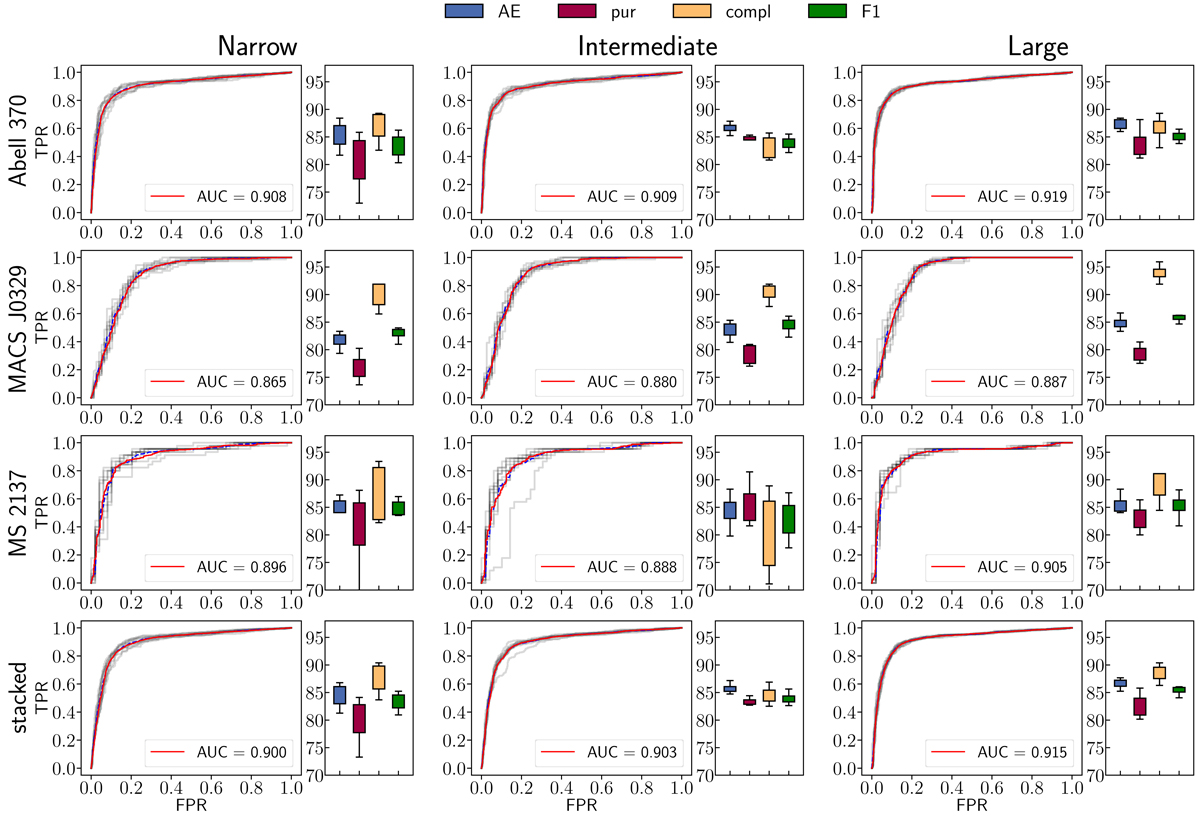
Summary of the EXP2 experiment. The statistical performances for the three clusters (A370, M0329 and MS2137) are reported in each row, while results for the three training configurations (i.e. narrow, intermediate and large) are organised by column. The global performances achieved by stacking together the three clusters are reported in the bottom row. For each test set, we display the ROC curves (grey lines refer to the performances achieved by any training fold, while the main trend is emphasised in red, together with its AUC score); the box plots represent the fluctuation of measured estimators related to the CLMs, together with the average efficiency measured for both classes. As in Fig. 5, such boxes delimit the 25th and 75th percentiles, while error bars enclose the maximum point variations.
Current usage metrics show cumulative count of Article Views (full-text article views including HTML views, PDF and ePub downloads, according to the available data) and Abstracts Views on Vision4Press platform.
Data correspond to usage on the plateform after 2015. The current usage metrics is available 48-96 hours after online publication and is updated daily on week days.
Initial download of the metrics may take a while.