Fig. 5.
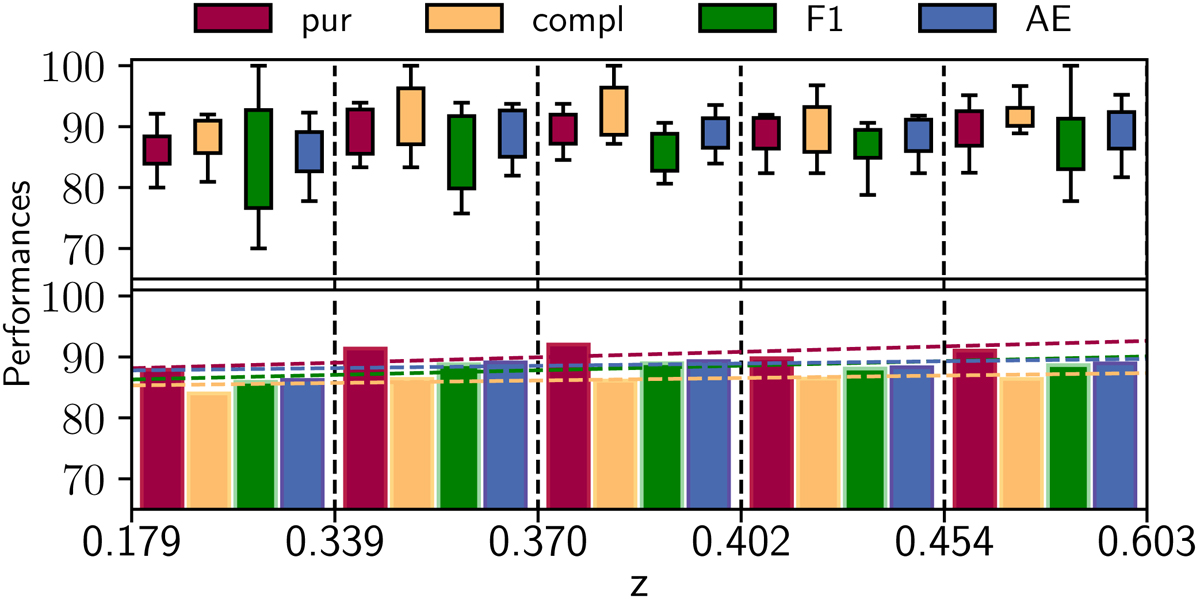
Percentages of CNN classification results for the four statistical estimators, measured as a function of CLM redshift range (EXP1). The top panel describes their fluctuation in each bin, with the boxes delimiting the 25th and 75th percentiles (first and third quartile) and error bars enclosing the maximum point variations. The bottom panel shows the same metrics globally evaluated in each redshift bin, together with the best-fit lines.
Current usage metrics show cumulative count of Article Views (full-text article views including HTML views, PDF and ePub downloads, according to the available data) and Abstracts Views on Vision4Press platform.
Data correspond to usage on the plateform after 2015. The current usage metrics is available 48-96 hours after online publication and is updated daily on week days.
Initial download of the metrics may take a while.