Fig. D.2.
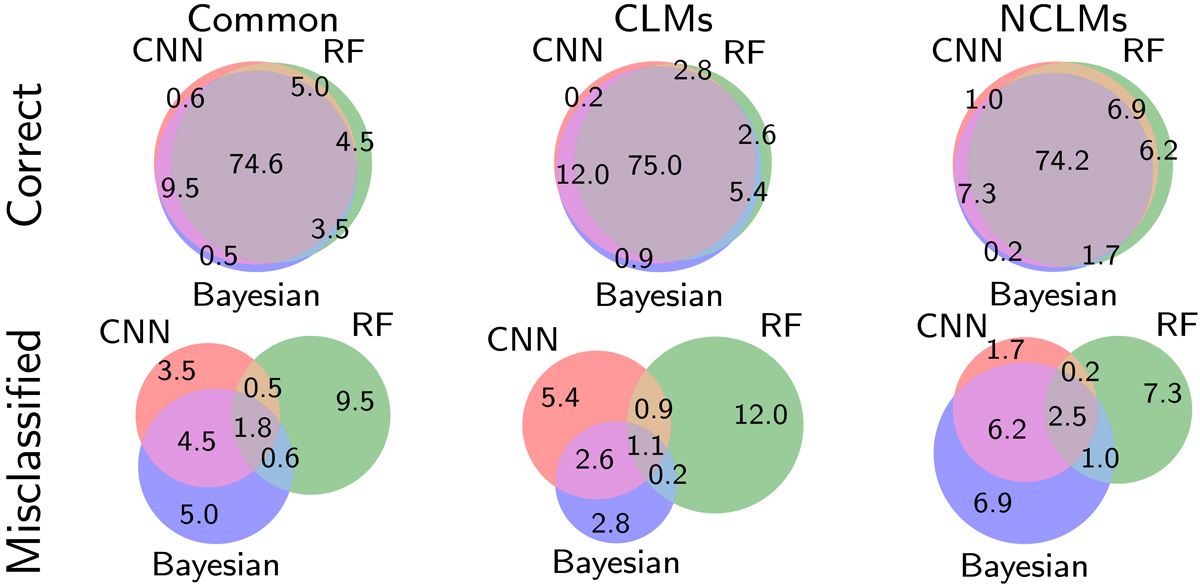
Venn diagrams reporting the percentages of membership predictions performed by three different methods (CNN, RF, and Bayesian), measured on the common blind test set, obtained by combining the four clusters R2248, M0416, M1206, and M1149 (EXP3). On the columns, the common areas refer to the available shared sources, respectively, 460 CLMs and 519 NCLMs). On the rows, common predictions are split between correct and incorrect classifications. Global commonalities can be derived by summing values on the rows.
Current usage metrics show cumulative count of Article Views (full-text article views including HTML views, PDF and ePub downloads, according to the available data) and Abstracts Views on Vision4Press platform.
Data correspond to usage on the plateform after 2015. The current usage metrics is available 48-96 hours after online publication and is updated daily on week days.
Initial download of the metrics may take a while.