Fig. D.1.
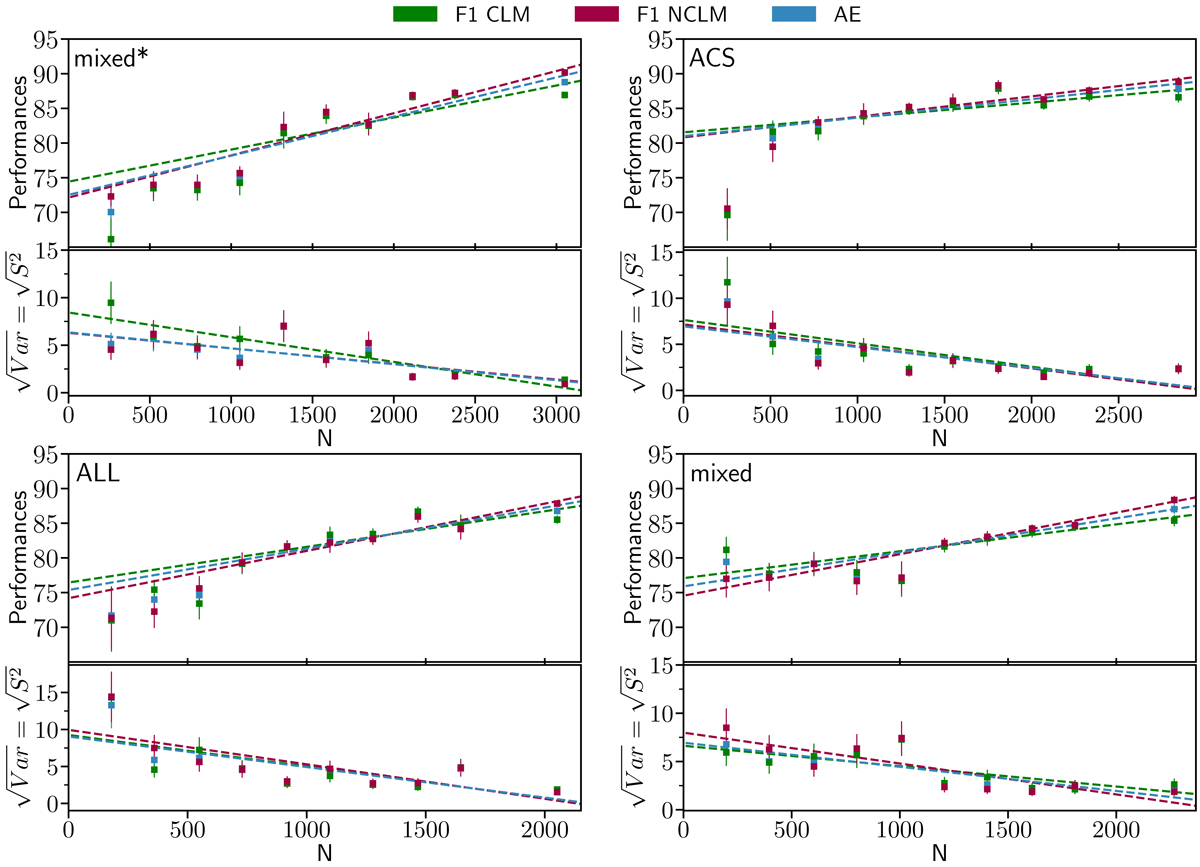
Comparison among the four band configurations (see Sect. 2), in terms of F1 score and average efficiency (AE) percentages (top panels), together with their square root of variances (bottom panels), as the number of spectroscopic sources in the training set increases (EXP1). In all panels, the linear best-fit trends are displayed as dashed lines. Due to the k-fold approach, performances have been averaged over the 10 folds, i.e. the x-axis shows the dimension of the training set, thus, the k-est fold used as test set has a size of N/9.
Current usage metrics show cumulative count of Article Views (full-text article views including HTML views, PDF and ePub downloads, according to the available data) and Abstracts Views on Vision4Press platform.
Data correspond to usage on the plateform after 2015. The current usage metrics is available 48-96 hours after online publication and is updated daily on week days.
Initial download of the metrics may take a while.