Fig. 15.
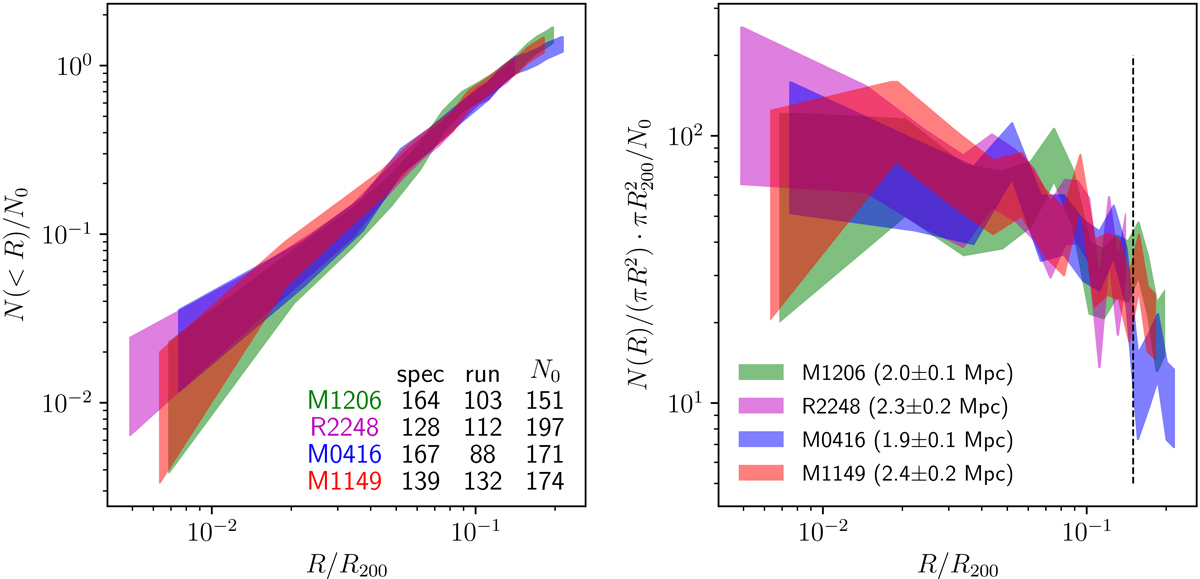
Cumulative (left) and differential (right) projected number of CLM for the four clusters (R2248, M0416, M1206, and M1149), including spectroscopic CLMs and candidate members identified by CNN (limited to F814 ≤ 25 mag). The areas correspond to the 68% confidence level regions. All profiles are normalised by the number N0 of members with R < 0.15 R200 in all clusters. The number of spectroscopic, CNN-identified members (“run”), and N0 values are quoted in the left panel. The adopted values of R200 are quoted in the right panel, the computed values of N0 are quoted in the left panel, together with the corresponding numbers of spectroscopic and “run” members. The dashed line in the right panel corresponds to R = 0.15 R200.
Current usage metrics show cumulative count of Article Views (full-text article views including HTML views, PDF and ePub downloads, according to the available data) and Abstracts Views on Vision4Press platform.
Data correspond to usage on the plateform after 2015. The current usage metrics is available 48-96 hours after online publication and is updated daily on week days.
Initial download of the metrics may take a while.