Fig. 14.
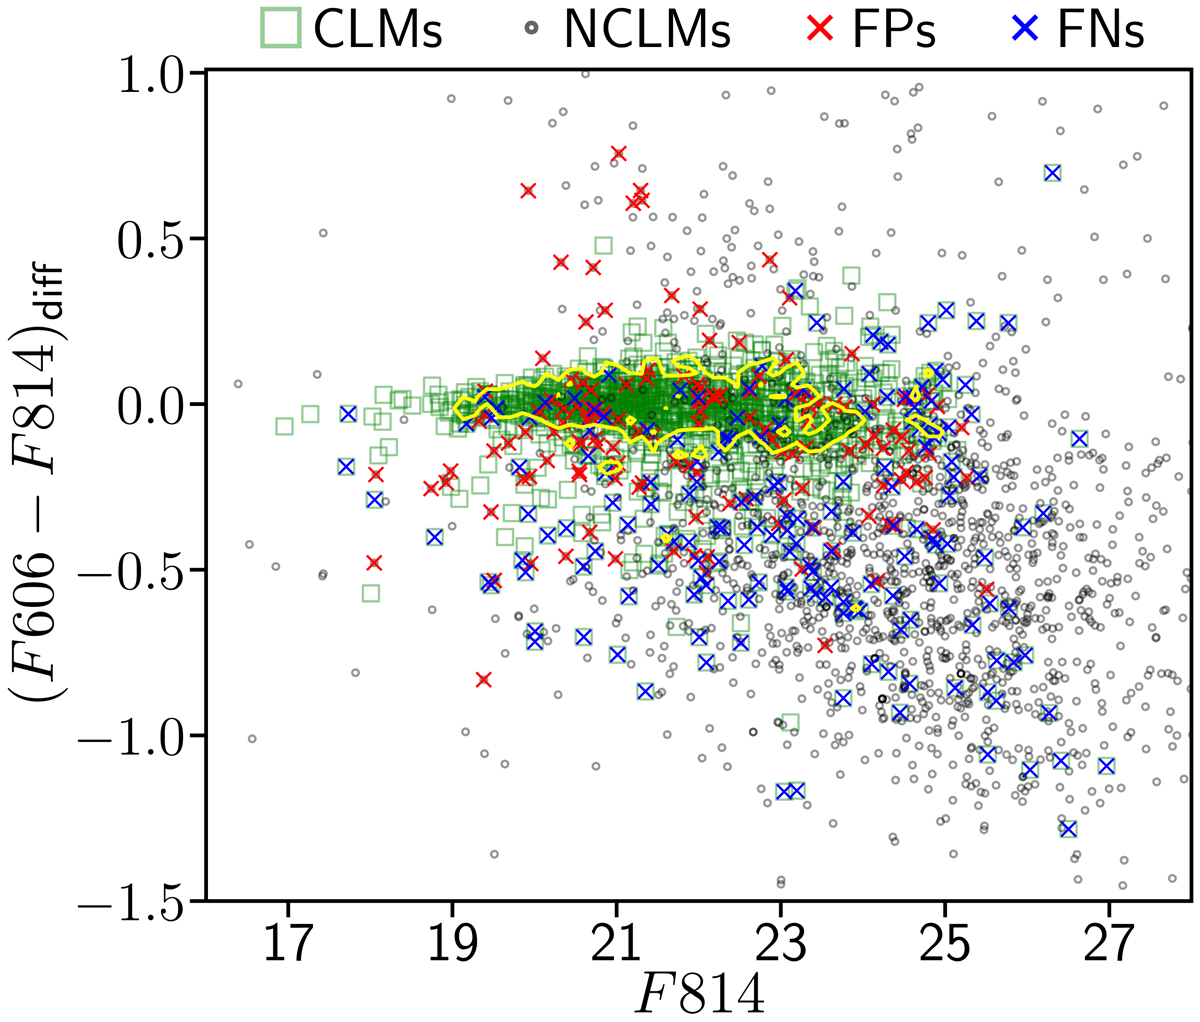
Colour-magnitude relation for the CLMs (green squares), with the overlapped distributions of FPs (red crosses), FNs (blue crosses) and NCLMs (grey circles), for the sample of fifteen clusters (stacked). The yellow contour delimits the red-sequence at 1σ confidence level. Colours reported on the y-axis are corrected for the mean red-sequence of each cluster (see Sect. 4).
Current usage metrics show cumulative count of Article Views (full-text article views including HTML views, PDF and ePub downloads, according to the available data) and Abstracts Views on Vision4Press platform.
Data correspond to usage on the plateform after 2015. The current usage metrics is available 48-96 hours after online publication and is updated daily on week days.
Initial download of the metrics may take a while.