Fig. 13.
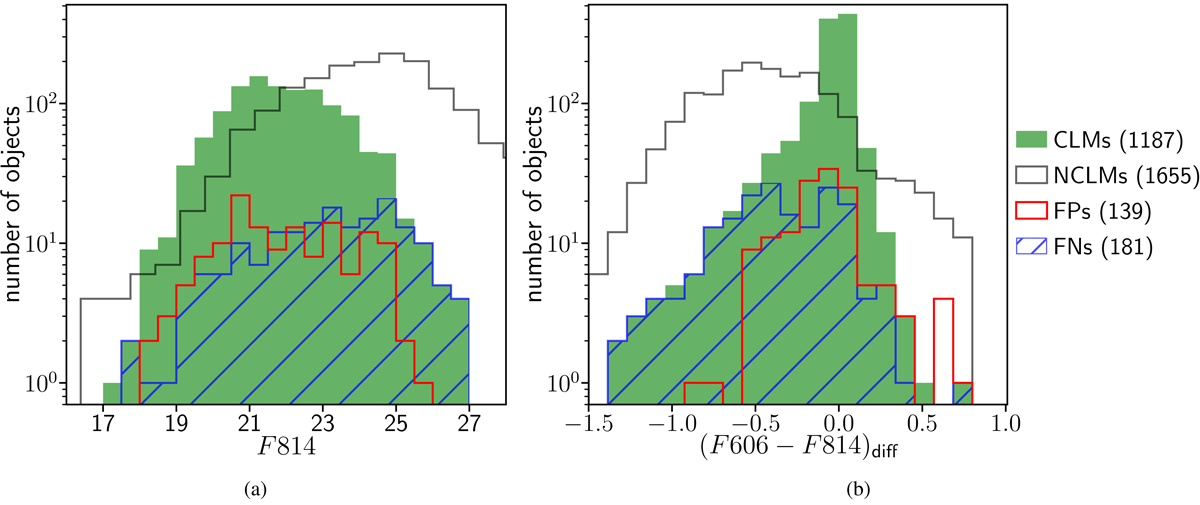
Magnitude (left panel) and colour (right panel) logarithmic distributions of FPs (red) and FNs (blue), overlapped to the CLM (green) and NCLM distributions, for the fifteen clusters (stacked) included in our study. The number of objects for each plotted distribution is quoted in brackets in the legend. The differential colour (F606 − F814)diff is obtained by applying the correction for the mean colour-magnitude relation for each cluster. Table 3 outlines such results.
Current usage metrics show cumulative count of Article Views (full-text article views including HTML views, PDF and ePub downloads, according to the available data) and Abstracts Views on Vision4Press platform.
Data correspond to usage on the plateform after 2015. The current usage metrics is available 48-96 hours after online publication and is updated daily on week days.
Initial download of the metrics may take a while.